Best Assisted Living Facilities in Vincennes, IN
Find local assisted living and retirement communities in the Vincennes, IN area.
4 Communities were found near Vincennes, IN
City
Care Type
- Adult Day Services
- Assisted Living
- Home Care
- Independent Living
- Memory Care
- Nursing Home
- Residential Care Home
- Senior Apartments
- Distance from City Center
- Highest Rating
- Name: A - Z
- Name: Z - A

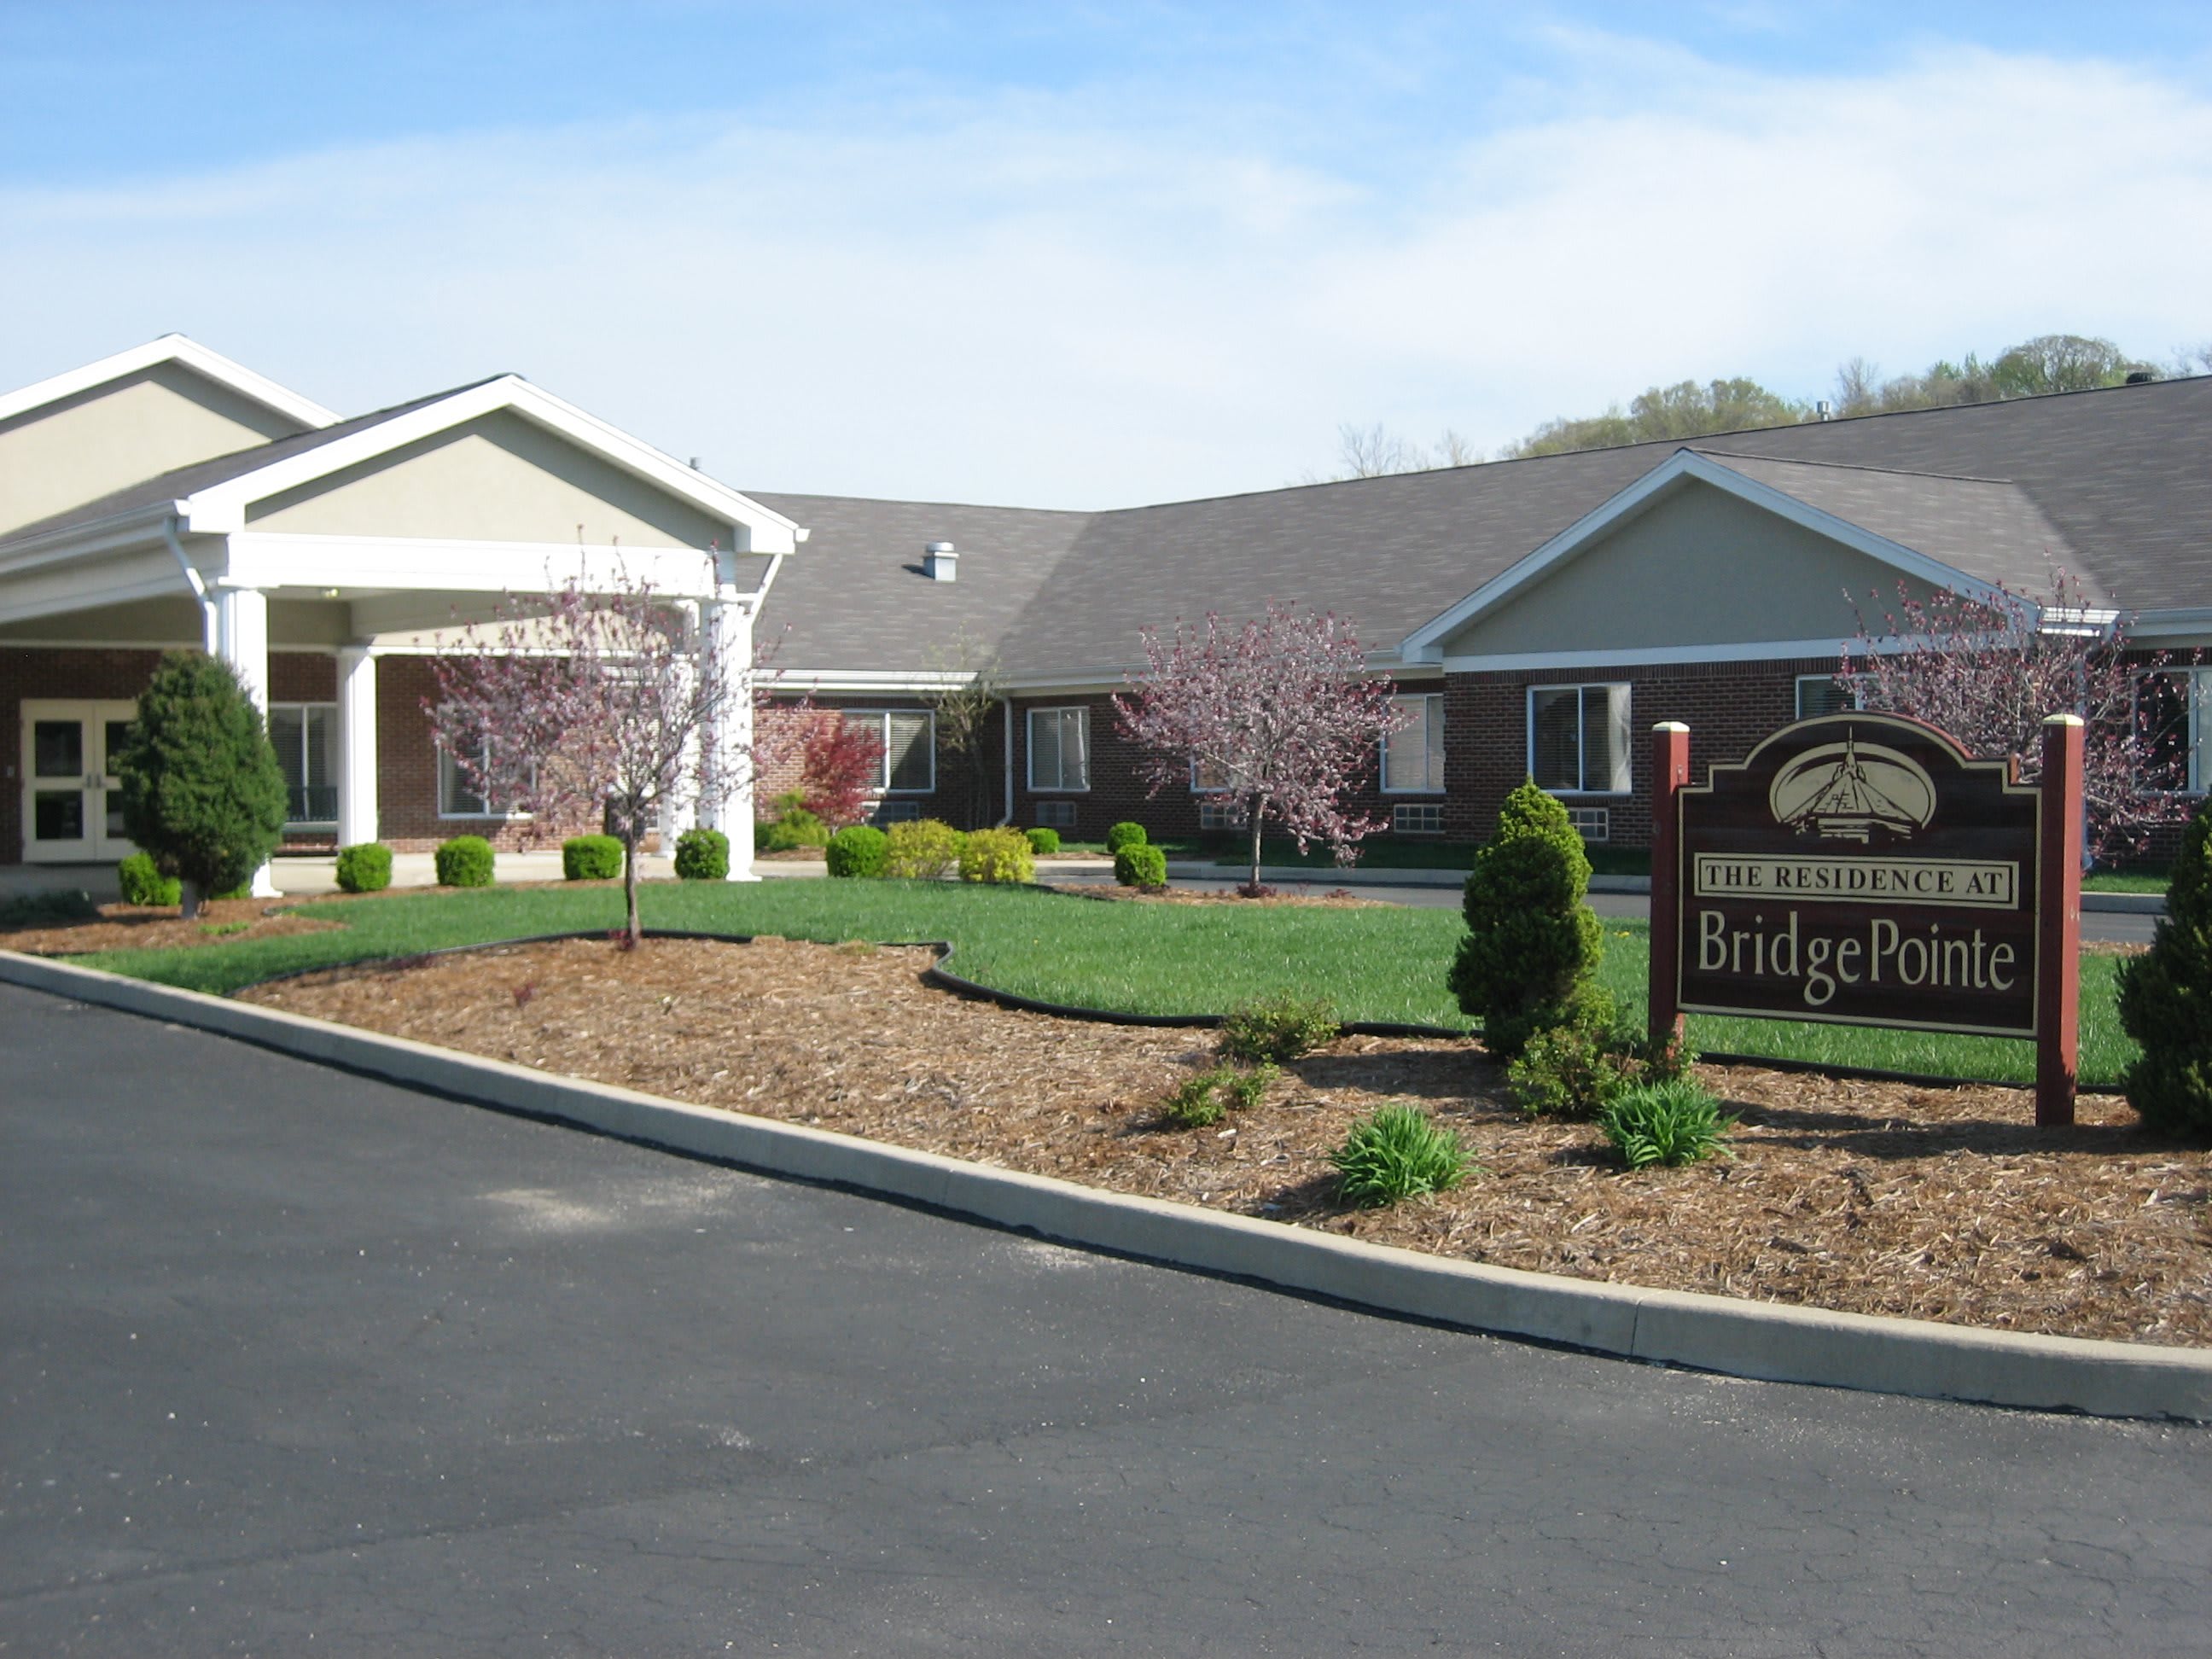
BridgePointe Health Campus
1900 College Ave, Vincennes, IN 47591 (0.4 mi from city center)
Assisted Living

Colonial Assisted Living Community of Vincennes
1622 S Hart Street Rd, Vincennes, IN 47591 (1.7 mi from city center)
Assisted Living

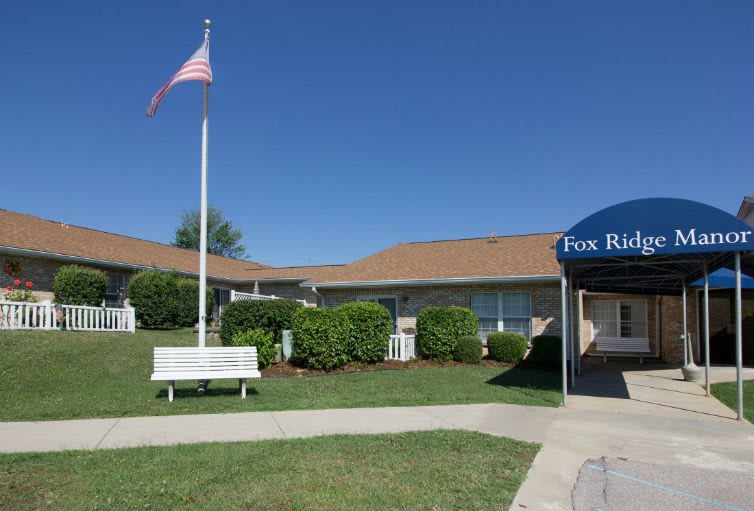
Fox Ridge Manor
150 Fox Ridge Dr, Vincennes, IN 47591 (2.4 mi from city center)
Independent Living
Map of Assisted Living in Vincennes
Find the right senior living community by location- I V Health Systems
- BridgePointe Health Campus
- Colonial Assisted Living Community of Vincennes
- Fox Ridge Manor
Senior Living Statistics for Vincennes, Indiana
Average Senior Living Costs by Housing Type
The cost of senior housing in Vincennes varies depending on the type of accommodation and level of care. The following is the average monthly cost of senior housing based on data from 2023-2024.
| Housing Type | Average Monthly Cost |
|---|---|
| Assisted Living | $3,688 |
| Memory Care | $4,701 |
| Independent Living | $2,930 |
| Nursing Home: Private Room | $3,750 |
| Nursing Home: Semi-Private Room | $2,775 |
| Nursing Home: Studio | $4,000 |
| Nursing Home: One Bedroom | N/A |
| Nursing Home: Two Bedroom | N/A |
| Nursing Home: Detached Cottage | N/A |
Average Cost of Assisted Living in Vincennes
The following is the average monthly cost of assisted living in Vincennes based on 2024 data.
| City | Average Monthly Cost |
|---|---|
| Vincennes | $3,688 |
| Elnora | $2,944 |
| Sandborn | $3,182 |
Here is how the average cost of assisted living in Vincennes compares to Indiana and the national average:
| Area | Average Monthly Cost |
|---|---|
| Vincennes | $3,688 |
| Indiana | $3,843 |
| United States | $4,546 |
Senior Living Availability in Vincennes
Number of senior living facilities in:
4
Vincennes
5
Surrounding Area
407
Indiana
Vincennes Senior Demographics
Based on information from 2023, here are some details around the population of Vincennes, such as age distribution for seniors, and racial diversity.
Population
Vincennes has a population of 16,715.- 50.1% Male
- 49.9% Female
Marital Status
- 42.4% Married
- 12.3% Divorced
- 38.2% Never Married
- 7.1% Widowed
Age
Seniors make up about 33.6% of the population.- 10.6% in their 50s
- 11.8% in their 60s
- 6.7% in their 70s
- 4.5% in their 80s
Diversity
- 86.5% White
- 4.7% Black
- 1.7% Asian
- 0.1% Native
- 0.2% Pacific
- 1.7% Identifying as Other
- 5.1% Mixed Race
- 4.7% Hispanic

