
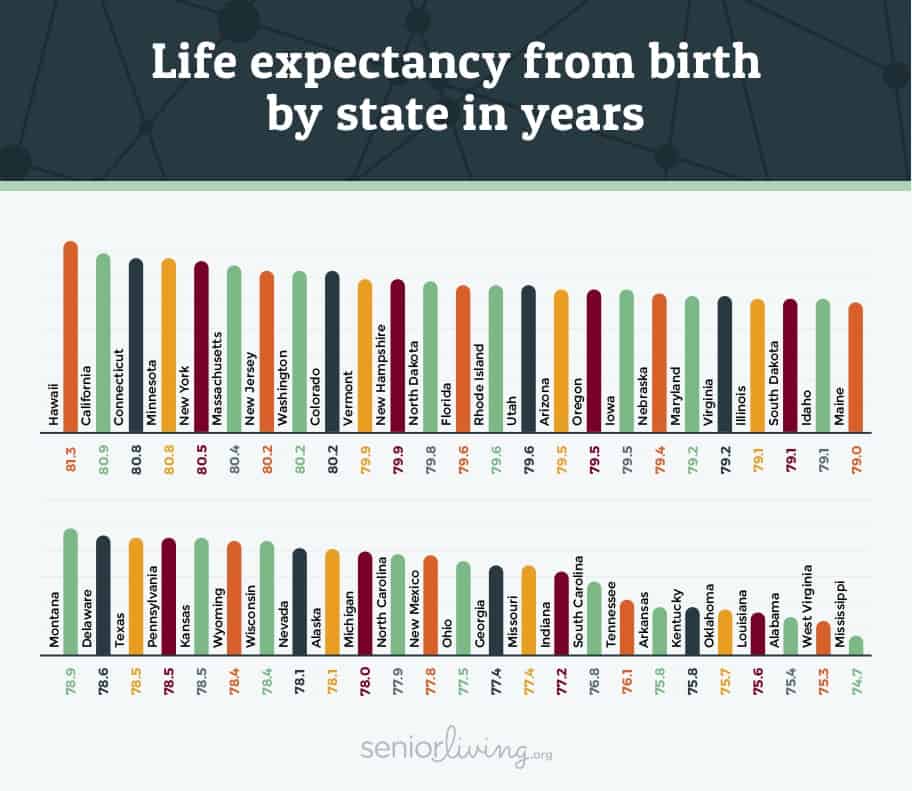
People in Hawaii have the longest life expectancy at birth at 81.3 years, while Mississippi's 74.7-year life expectancy is the nation's lowest. The nine lowest life expectancy states are all in the South.
2026 Average Life Expectancy Statistics in the United States
As fictional optimist Chris Traeger once declared, “Scientists believe that the first human being who will live 150 years has already been born. I believe I am that human being.” While we literally can't know if Chris's prediction came true since he's a character from “Parks and Recreation” and not a real person, the past few years of trends may throw cold water on that view.
Average American life expectancy, which had seen decades of improvement, has fallen for the past three consecutive years, according to a recent report by the federal Centers for Disease Control and Prevention. Though the decline is modest (78.8 years to 78.6 years), the fact that U.S. life expectancy is falling at all is cause for concern, and the consistent decline over the past few years is the worst life expectancy showing our country has had since a period between 1915 and 1918.
There's no doubt the average American life is healthier and longer than it was over 100 years ago, but our modern lives are beginning to see a shift not just in how long we live but in what issues are most likely to contribute to our deaths. Heart disease and cancer remain the two leading causes of death, but recent years have seen huge increases in death rates from suicide, drug addiction and alcoholism.
But the United States is a geographically vast and demographically diverse nation, and what's true on a national level may not play out in the same way on a state level. So we wanted to take a microscope to life expectancy and the changes observed in several causes of death to see which states have made the most progress in certain areas and which states are the epicenters of the tragic changes we've seen over the past decade.
>>Read More: Life Expectancy Calculator
Which States Have the Longest Lifespans?
While the recent CDC report, which was released late in 2018, does not provide a breakdown of life expectancy by state, the Journal of the American Medical Association published a study in 2018 that examined life expectancy between 1990 and 2016. While those figures are now a few years old, they still provide a helpful baseline to understand where in the nation people live the longest (or shortest).
Did You Know? It's important to be proactive about our health as we age to improve life expectancy. One big part of being proactive is getting regular checkups with your doctor, dentist, and other health care providers. Visit our guide to insurance for seniors to make sure you have all your bases covered.
![]()

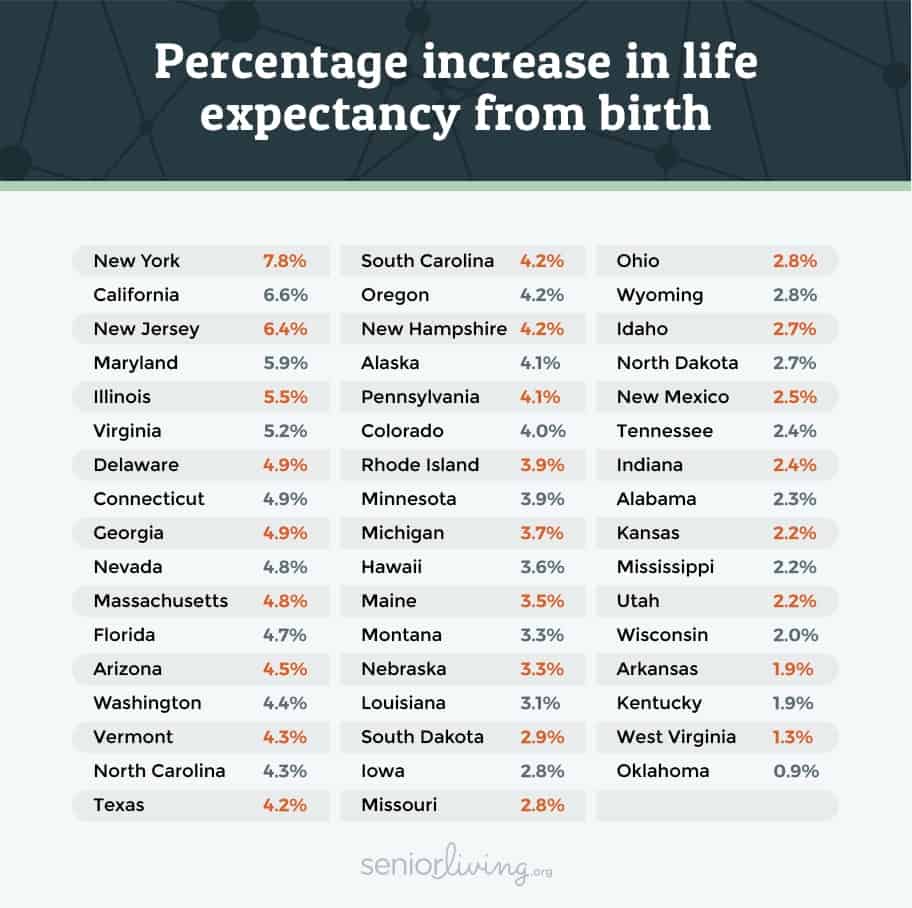
While the JAMA study shows increases in life expectancy for each state over the study period, that's to be expected given that the analysis looked at a 26-year period before the U.S. began to see an overall trend downward in life expectancy. No states showed a decrease between 1990 and 2016, but several had modest gains, including Oklahoma's 0.9% increase, which was the smallest gain. New York showed by far the highest increase in life expectancy with a 7.8% increase.
What’s Killing Us The Most?
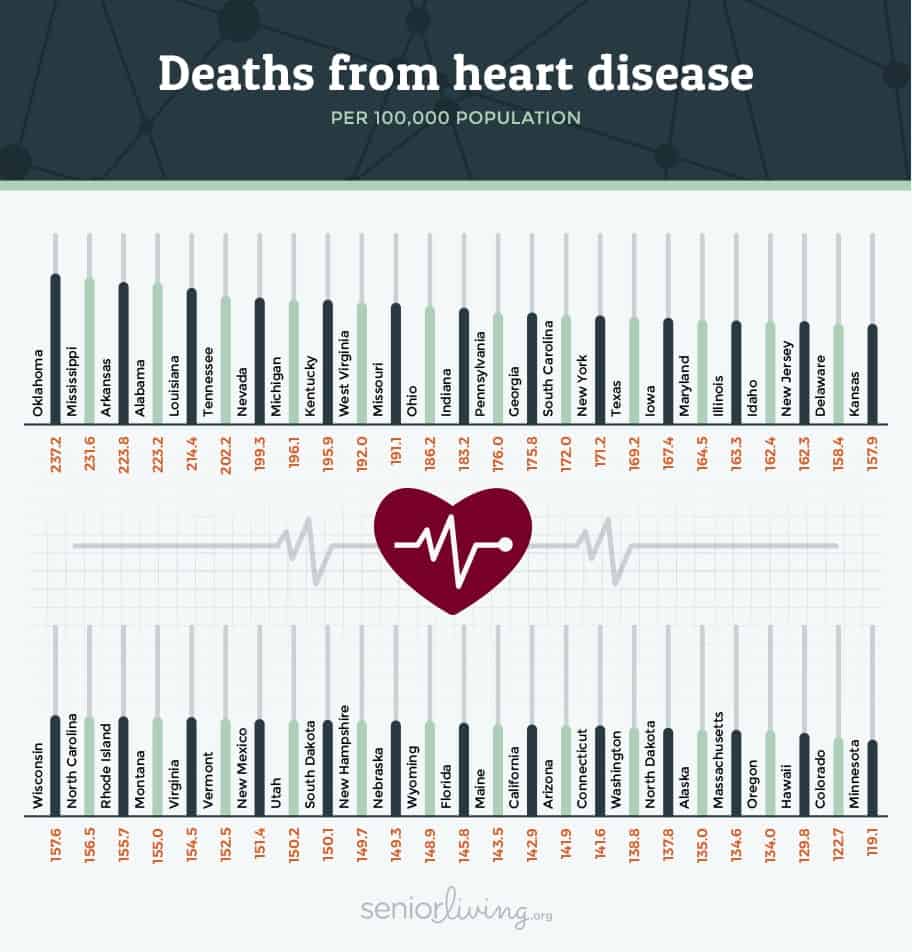
Heart disease and cancer remain the biggest killers of Americans, combining to cause more than 40% of all deaths. Heart disease and cancer kill more Americans than the next six top causes of death combined. In every state, heart disease and cancer rank as the No. 1 and No. 2 killers, though not always in that order.
Did You Know? 32,000 seniors die after experiencing a fall every year,1 making falls another big killer for seniors. Medical alert systems can help protect you from major injuries after a fall. Visit our guide to medical alert systems to learn more. Then, head to our list of the best medical alert systems to find a provider that's right for you.
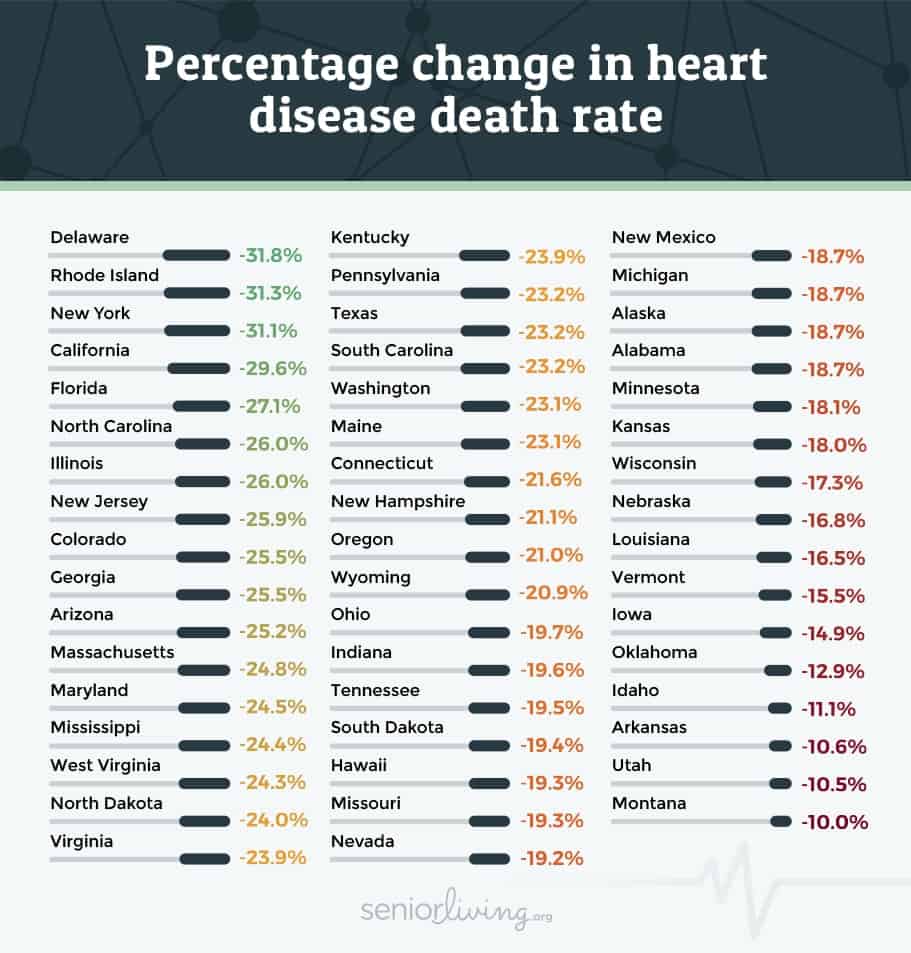
These two issues combine to cause about 1.2 million deaths in the U.S. each year; still, a great deal of progress has been made over the past decade in curbing death rates for both heart disease and cancer. So much so that when looking on a state-by-state level, we can see that every single state has lowered its rate of citizens dying from those conditions and that, with the exception of one state, all the decreases have been in the double digits.
Heart Disease
Heart disease death rates are highest in the South, where eight of the 10 states with the highest rates are located.
![]()

Three states managed to produce 30%+ drops in their heart disease death rates between 2005 and 2017, according to CDC data — Delaware (-31.8%), Rhode Island (-31.3%) and New York (-31.1%). While no state recorded an increase in its heart disease death rate, three states had drops of around 10% — Arkansas (-10.6%), Utah (-10.5%) and Montana.
Cancer
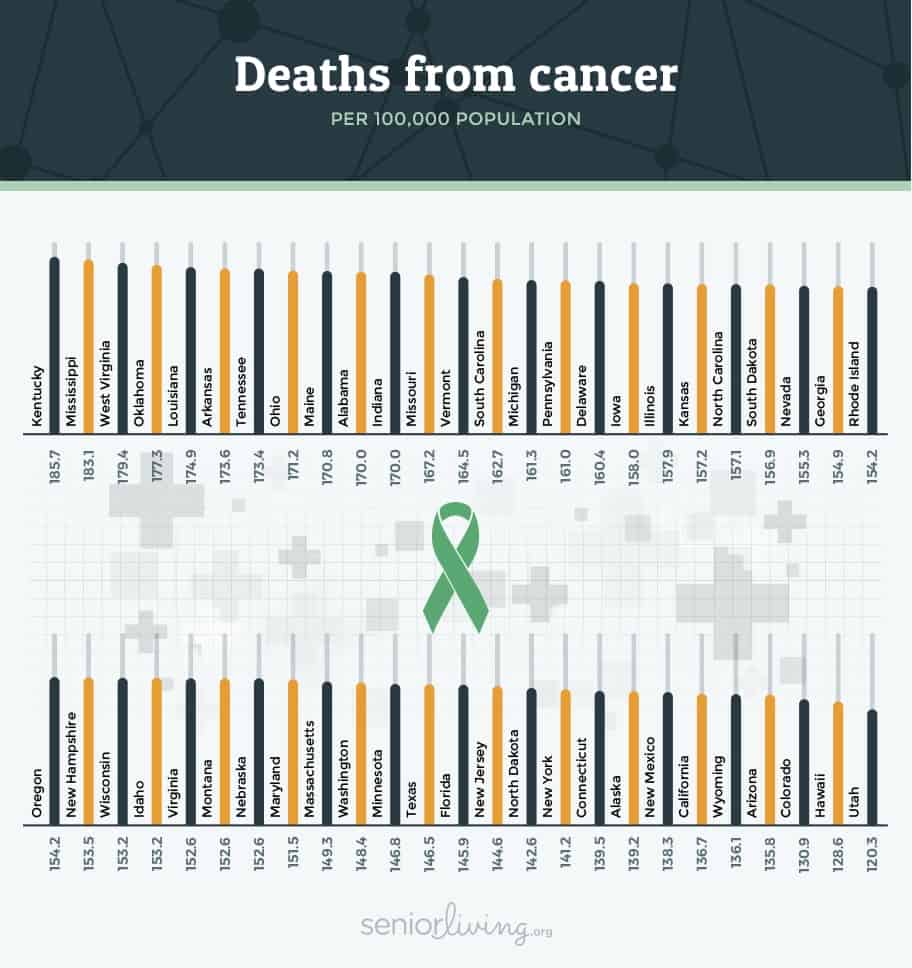
As the second-leading cause of death nationally, cancer is responsible for over 1 in 5 deaths in the U.S. every year. Cancer death rates are highest in Kentucky (185.7 per 100,000) and lowest in Utah (120.3 per 100,000).
![]()
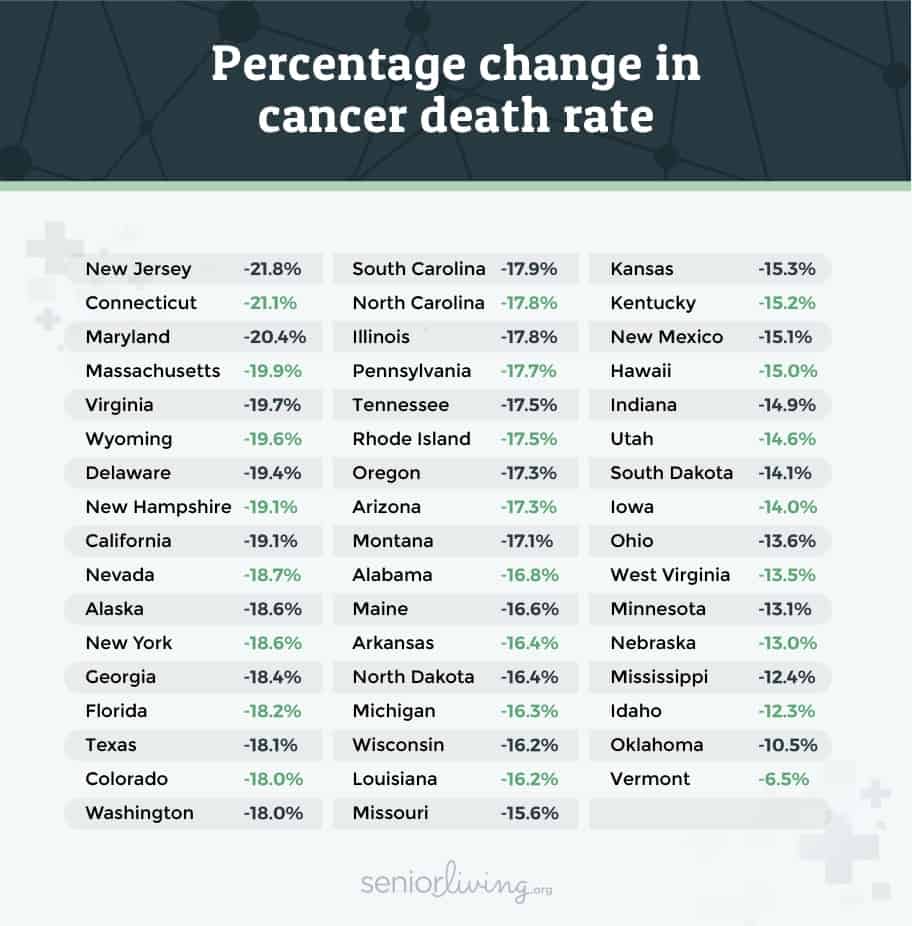
All states have seen their cancer death rates decline over the past decade, though some states have made more progress than others. Seven of the 10 states with the biggest drops in the rate of cancer deaths are on the East Coast, while another eastern state, Vermont, posted the most modest decline, just 6%, the only single-digit decline recorded in either cancer or heart disease death rates.
What’s Gaining Ground on Us?
While suicide has been one of the 10 leading causes of death in the United States since 2008, death rates from intentional self-harm are skyrocketing, along with deaths from drug overdose and liver disease, which is most frequently connected with alcoholism and habitual binge drinking.
Suicide
More than 47,000 people took their own lives in 2017, according to CDC data, putting suicide at the No. 10 position in the top causes of death.
![]()
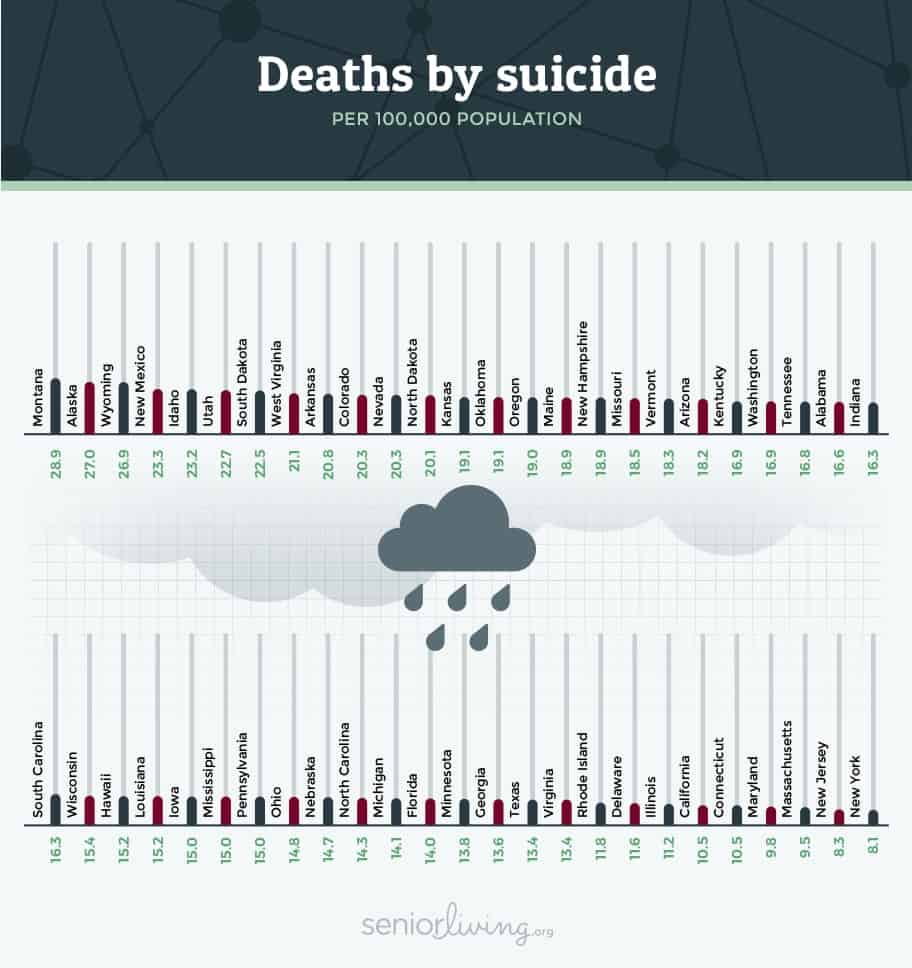
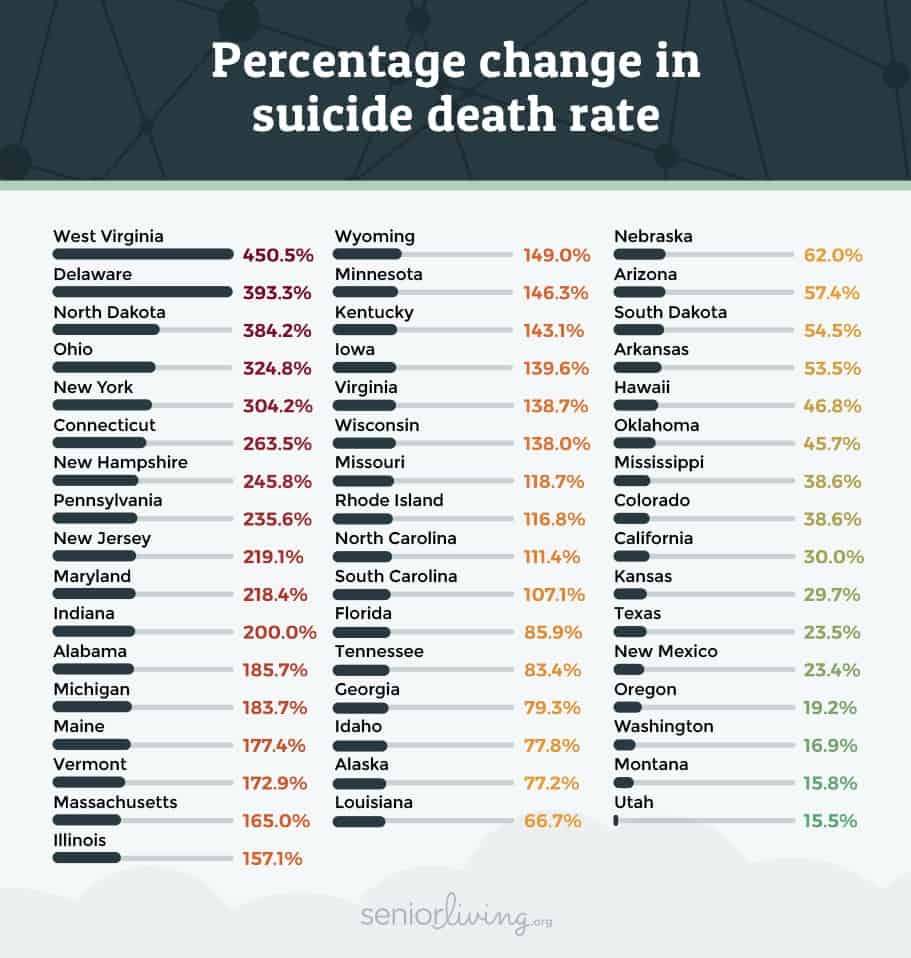
No state has observed a drop in the rate of deaths from suicide since 2005, and a couple of states have seen their rates nearly double. Nevada saw the smallest change, but the state's suicide death rate still ranks in the top 10.
Did You Know? Feelings of loneliness can lead to suicidal ideation and behavior.2 It's important to stay connected with loved ones for support and to remind you that you're not alone. If you don't live near loved ones, buying a cell phone is an easy way to stay connected through calls, texts, social media, or video chats. Visit our list of the best cell phones for seniors to find a phone that's right for you.
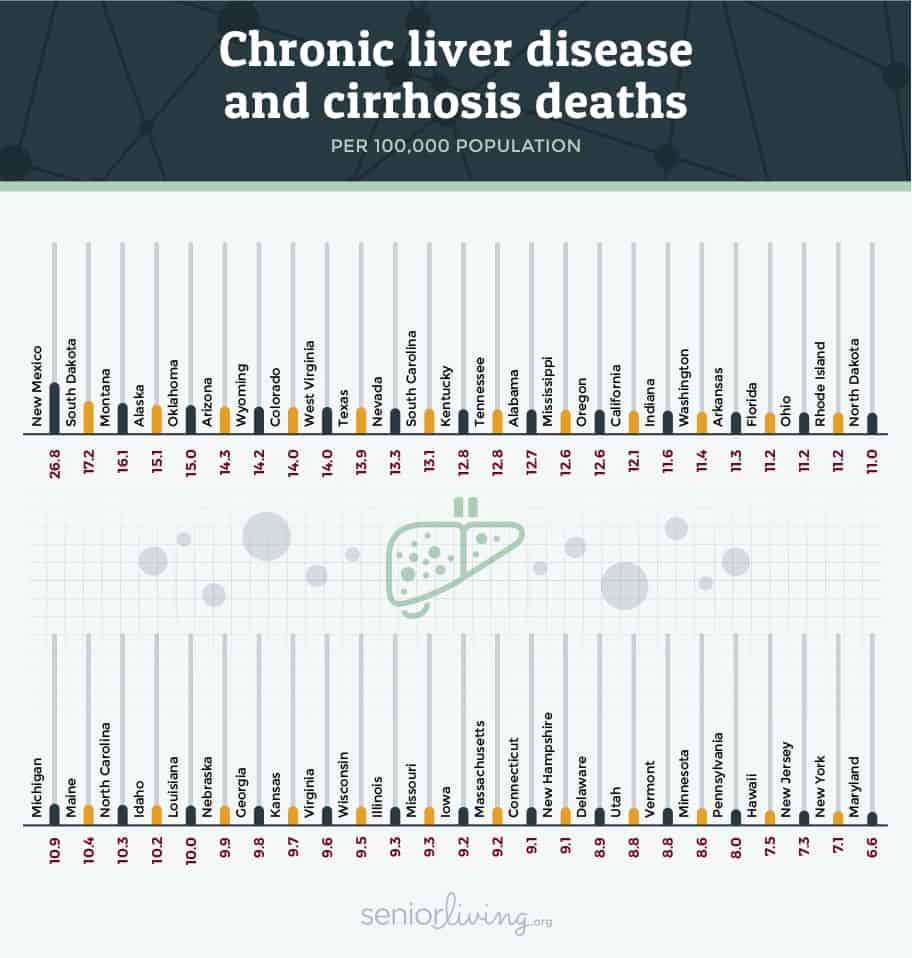
Chronic Liver Disease
Most frequently caused by alcohol abuse, chronic liver disease once was among the top 10 causes of death overall in the United States, and it remains a top cause for men, though it's no longer a top 10 cause for women.
![]()

New Mexico has by far the highest rate of deaths from chronic liver disease and cirrhosis (26.8 per 100,000), while Maryland's rate of 6.6 per 100,000 is the lowest.
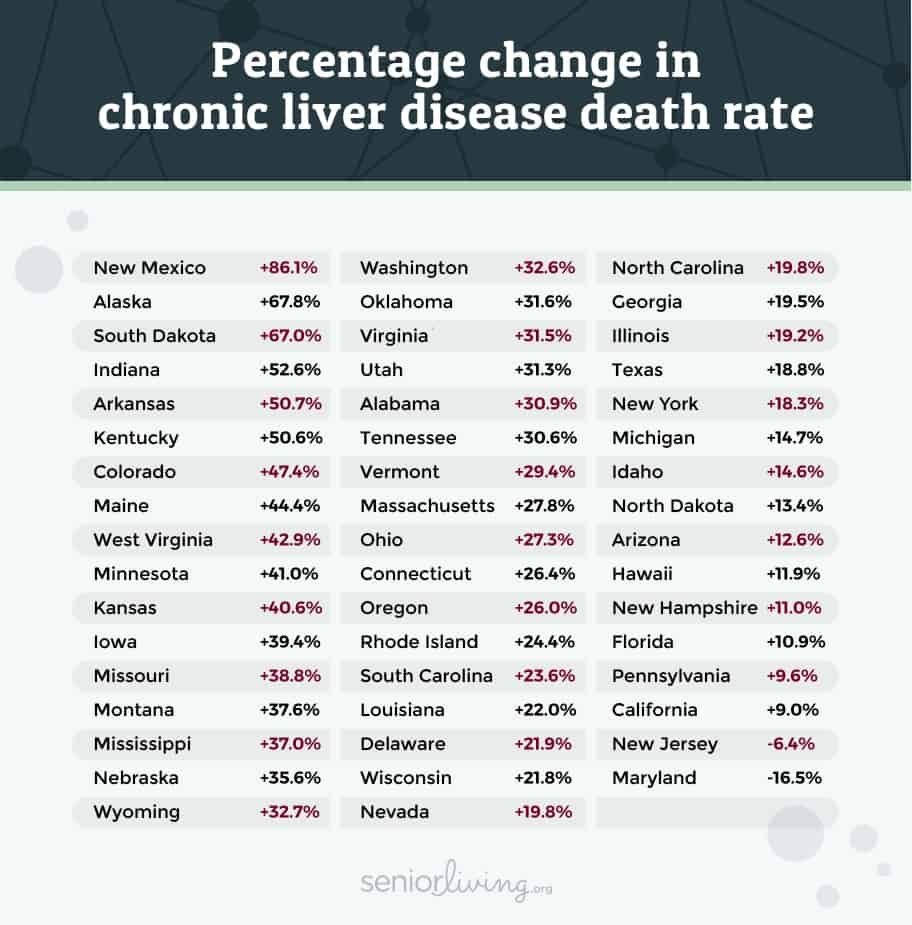
It's likely Maryland's placement as the state with the lowest rate of chronic liver disease deaths is owing in part to the double-digit drop recorded in the state's death rate. Maryland was just one of two states to see their chronic liver disease death rate fall. Conversely, New Mexico saw the nation's largest increase in liver disease deaths and ranks at the very top of the overall death rate list.
Drug Overdose
Nearly 130 Americans die every day from opioid overdose, and more than 70,000 drug overdose deaths occurred in the United States in 2017.
![]()

Drug overdose deaths are most common West Virginia (57.8 per 100,000) and least common in Nebraska (8.1 per 100,000).
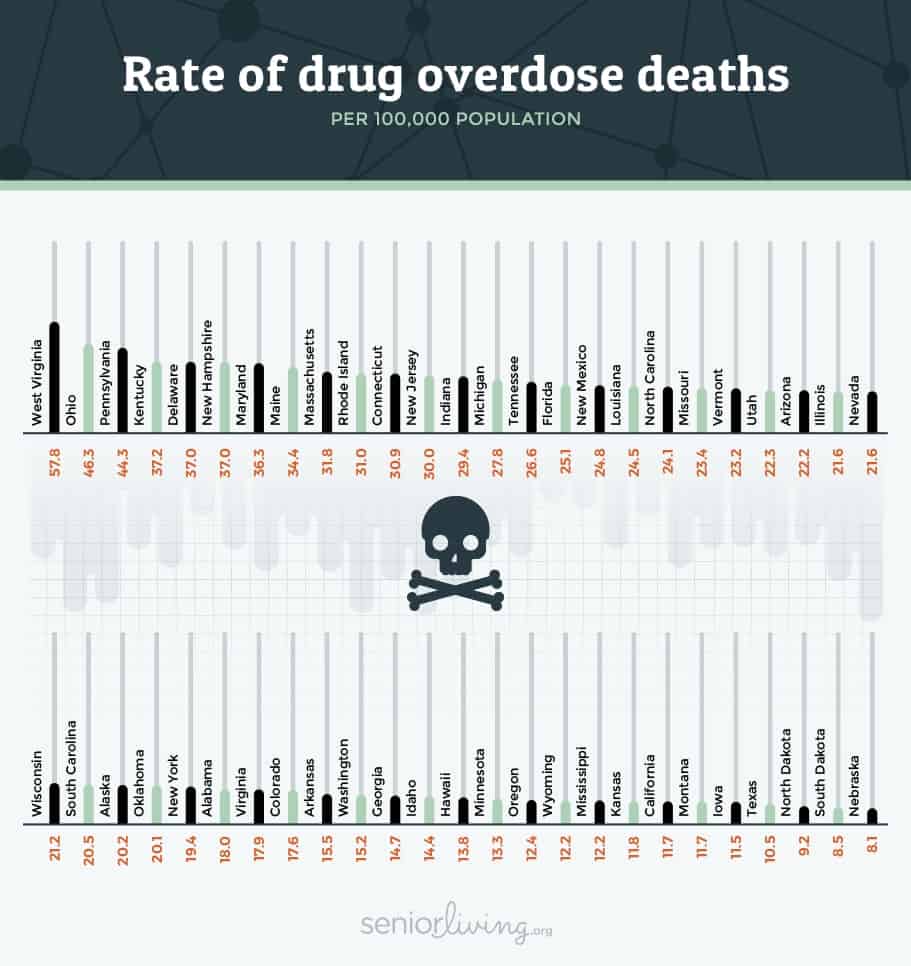
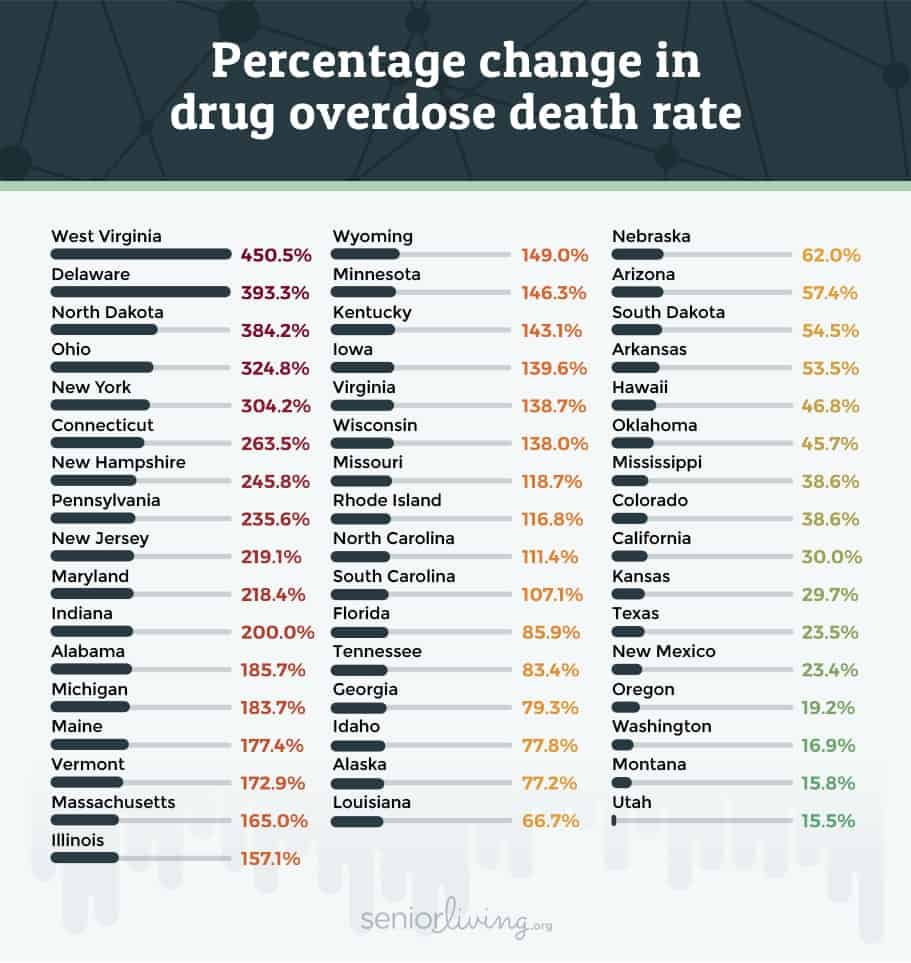
While some states are more fortunate in that their rates of drug deaths are much lower than the states with the highest rates on this list, the truth is that nowhere in the United States is immune from this crisis. Even just over the course of one year, 2016 to 2017, the CDC reported a nearly 10% increase in the rate of drug OD deaths in the U.S. This crisis is at epidemic levels, and it's not hard to see why. All 50 states saw at least double-digit increases in the rate of drug overdose deaths between 2005 and 2017, and tragically, more than half the states recorded increases in the triple digits.
Conclusion
We've made enormous strides over the years in raising awareness of and combatting what were previously considered the biggest medical threats we faced, from heart disease to cancer. But now pernicious new crop of conditions threaten to undo the years of medical and healthcare gains that have been made in the United States. It's true that the average American still is more likely to die from heart disease than from drug overdose, the huge jumps in these mental health-related causes of death are incredibly disturbing.
We can't expect to solve substance abuse or depression tomorrow, but a crucial first step is simply getting our arms around the scope of this problem. If not, the increases in deaths from suicide, alcoholism and drug abuse that we've seen over the past decade could pale in comparison to the problems we'll face if these issues go unchecked.
About This Report
Death rates and change over time: Most of the information on this page came from the federal Centers for Disease Control and Prevention. We've included direct links to some of the data, but most of it, including the percentage increases and decreases in rates of deaths, were calculated by accessing the CDC's Stats of the States tool. That page's Causes of Death tab includes years of reports on nearly 20 major causes of death. We used the data from 2017 and from 2005 to calculate the change. In some cases, the CDC does not list a per 100,000 death rate for particular states because so few deaths were recorded. In those cases, we calculated the death rate manually using each state's population at the time.
Other information: We've included direct links to all other information used on this page throughout the text.
Fair Use Statement
Feel free to share the material on this page for noncommercial purposes. When using any text or images from this page, please properly attribute the material and include a link back to the URL of this page.
Looking for data or expertise to support your work? See our open data portal, or reach out to us at open-data@seniorliving.org to connect with an expert on aging in America.