Best Assisted Living Facilities in Lynchburg, VA
Find local assisted living and retirement communities in the Lynchburg, VA area.
9 Communities were found near Lynchburg, VA
City
- Bedford, VA
- Adult Day Services
- Assisted Living
- Home Care
- Independent Living
- Memory Care
- Nursing Home
- Residential Care Home
- Senior Apartments
- Distance from City Center
- Highest Rating
- Name: A - Z
- Name: Z - A
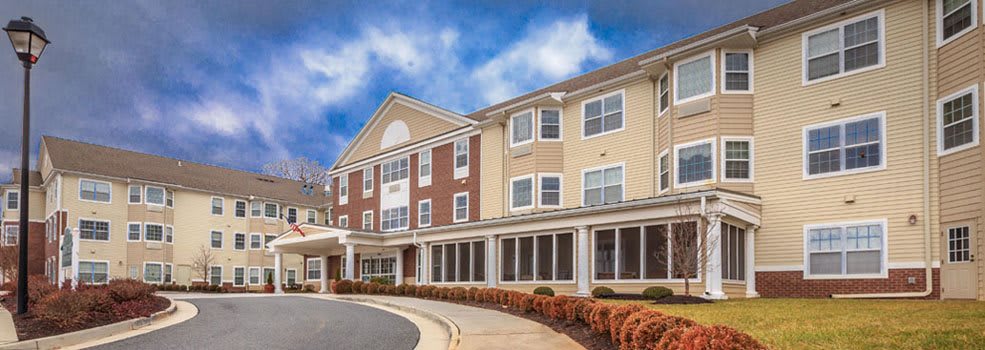
Bentley Commons at Lynchburg
1604 Graves Mill Road, Lynchburg, VA 24502 (3 mi from city center)
Assisted Living
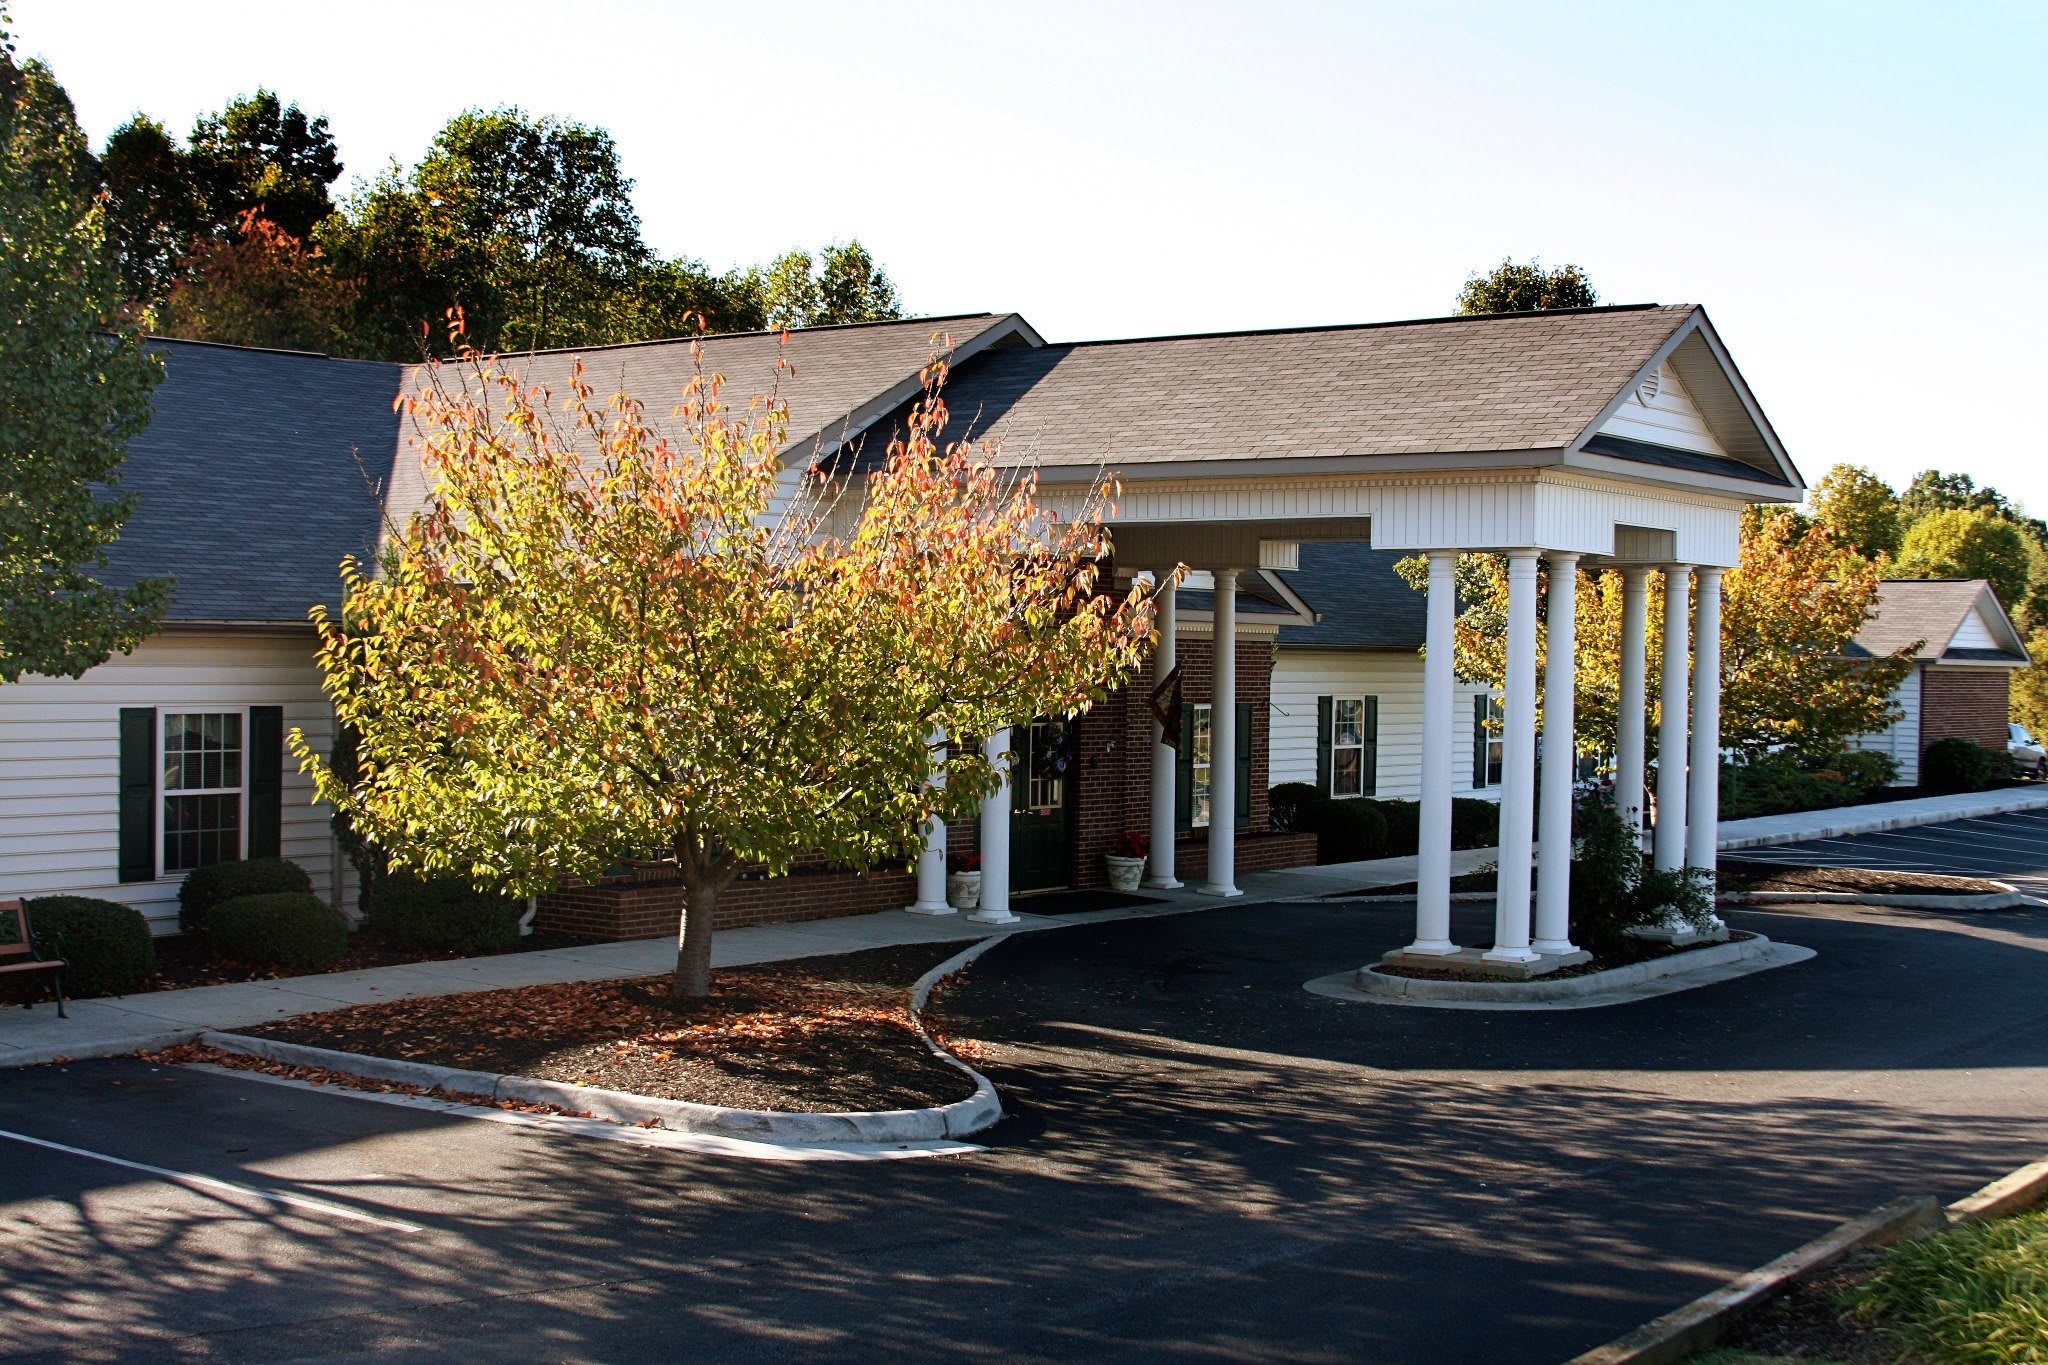
Heritage Green and Daybreak
200 Lillian Lane, Lynchburg, VA 24502 (3.1 mi from city center)
Assisted Living
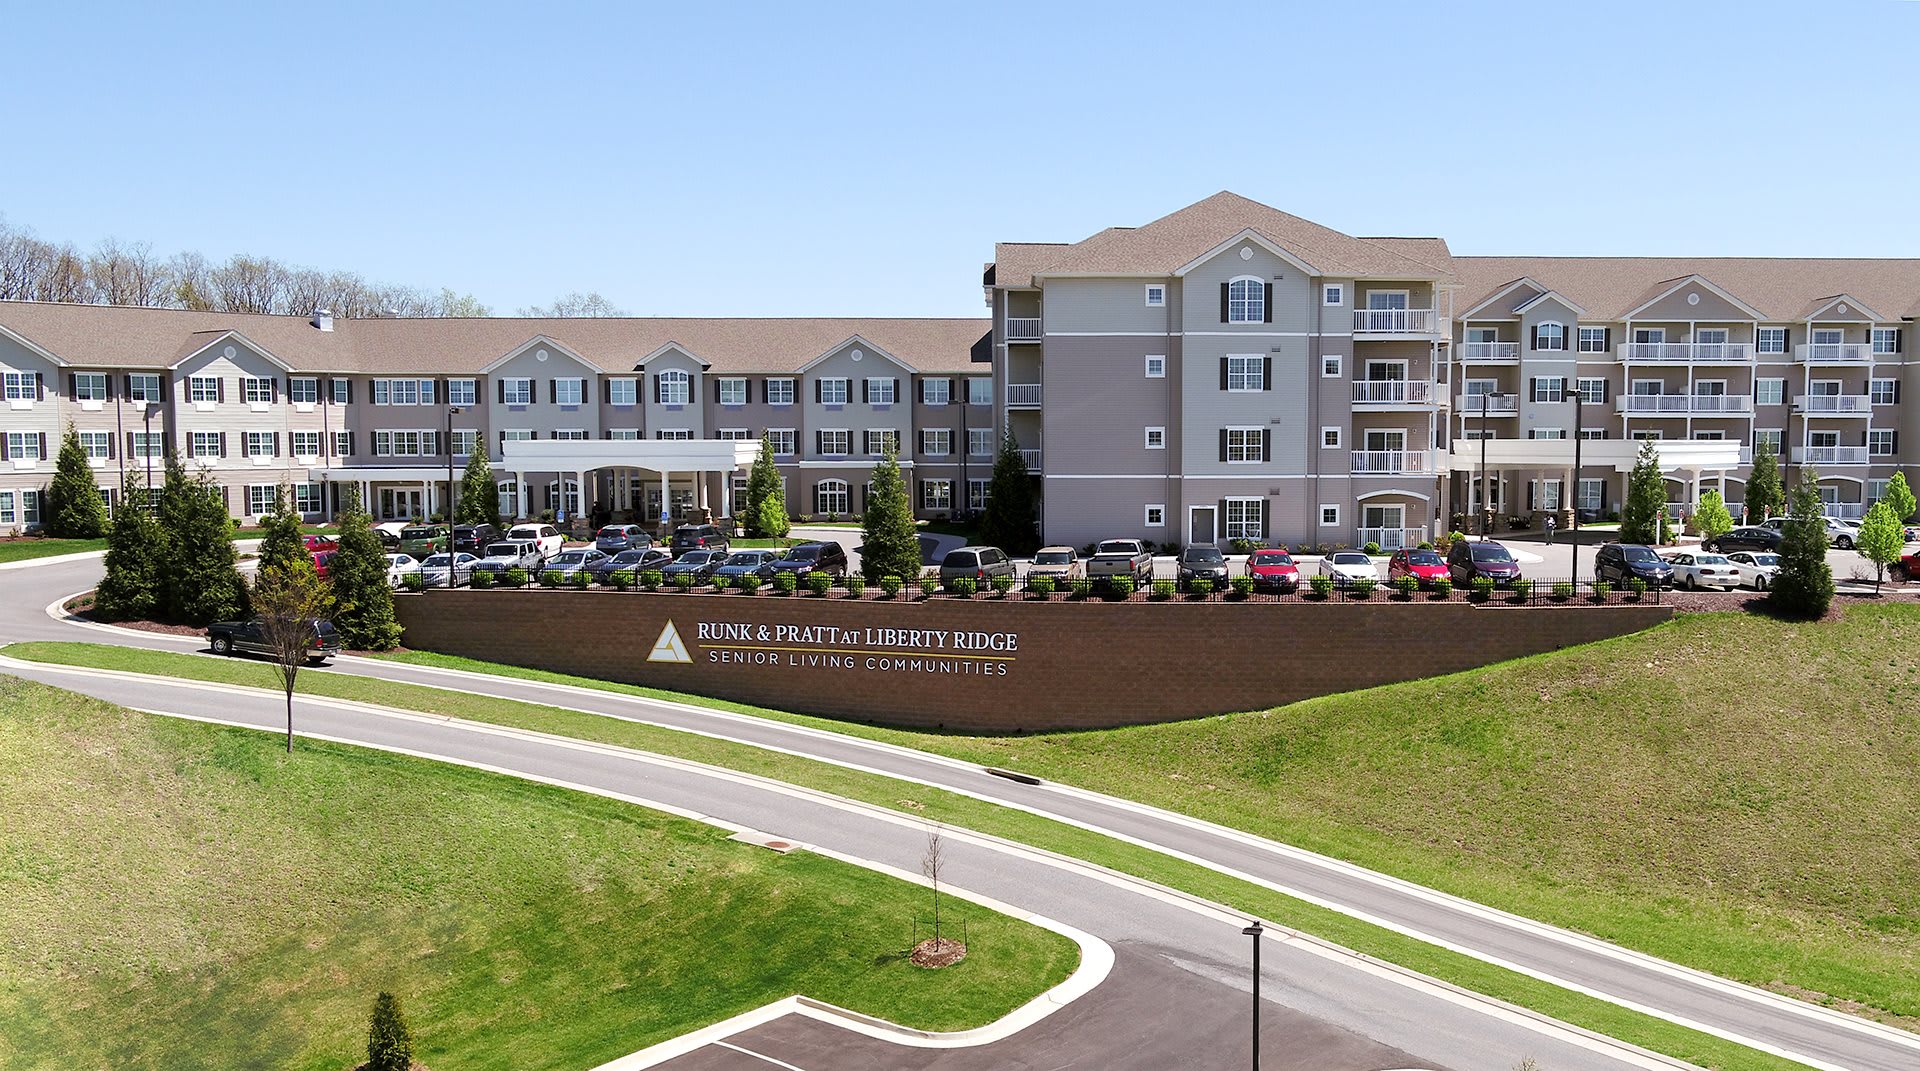
Runk and Pratt at Liberty Ridge
30 Monica Blvd, Lynchburg, VA 24502 (3.1 mi from city center)
Assisted Living

Care Advantage of Lynchburg, VA
22634 Timberlake Rd Ste E, Lynchburg, VA 24502 (3.2 mi from city center)
Home Care
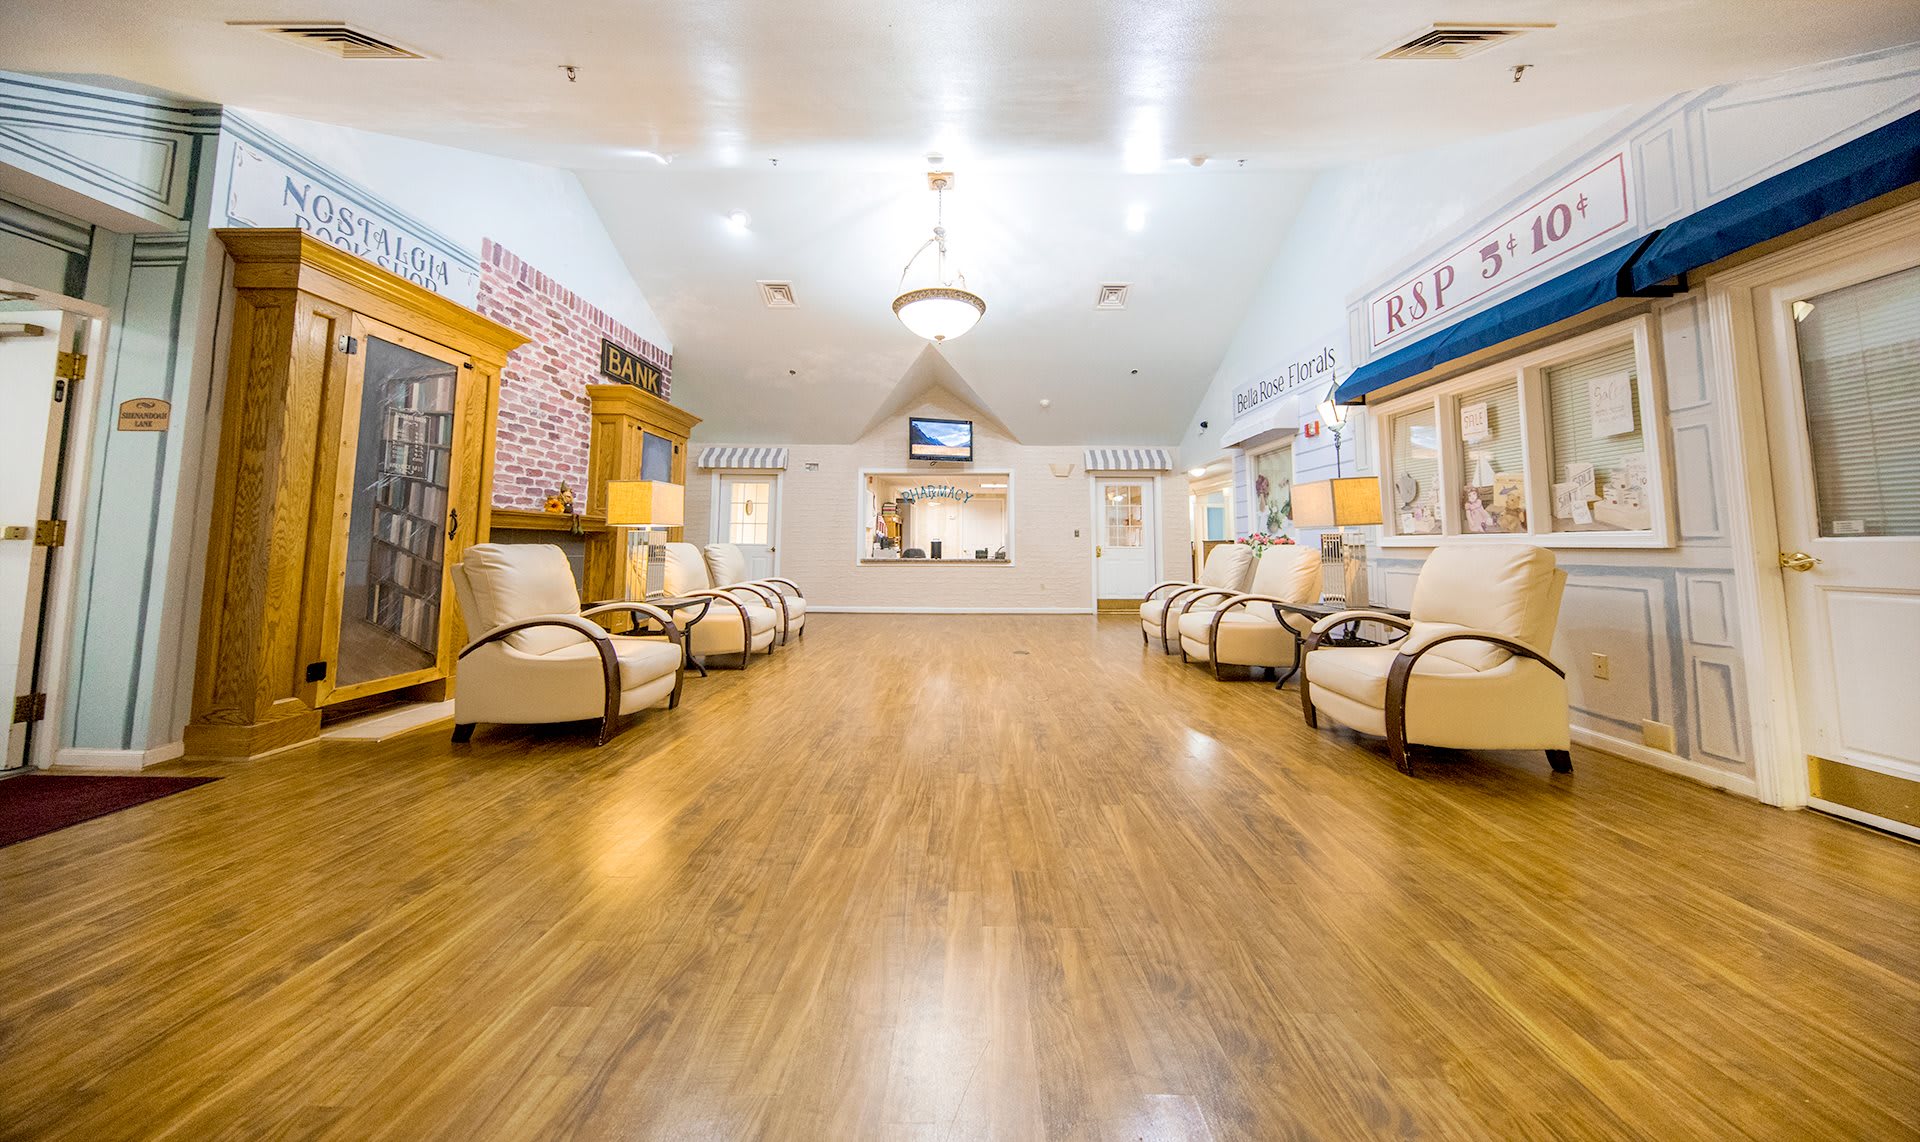
Runk and Pratt of Forest
208 Gristmill Drive, Forest, VA 24551 (3.5 mi from city center)
Memory Care
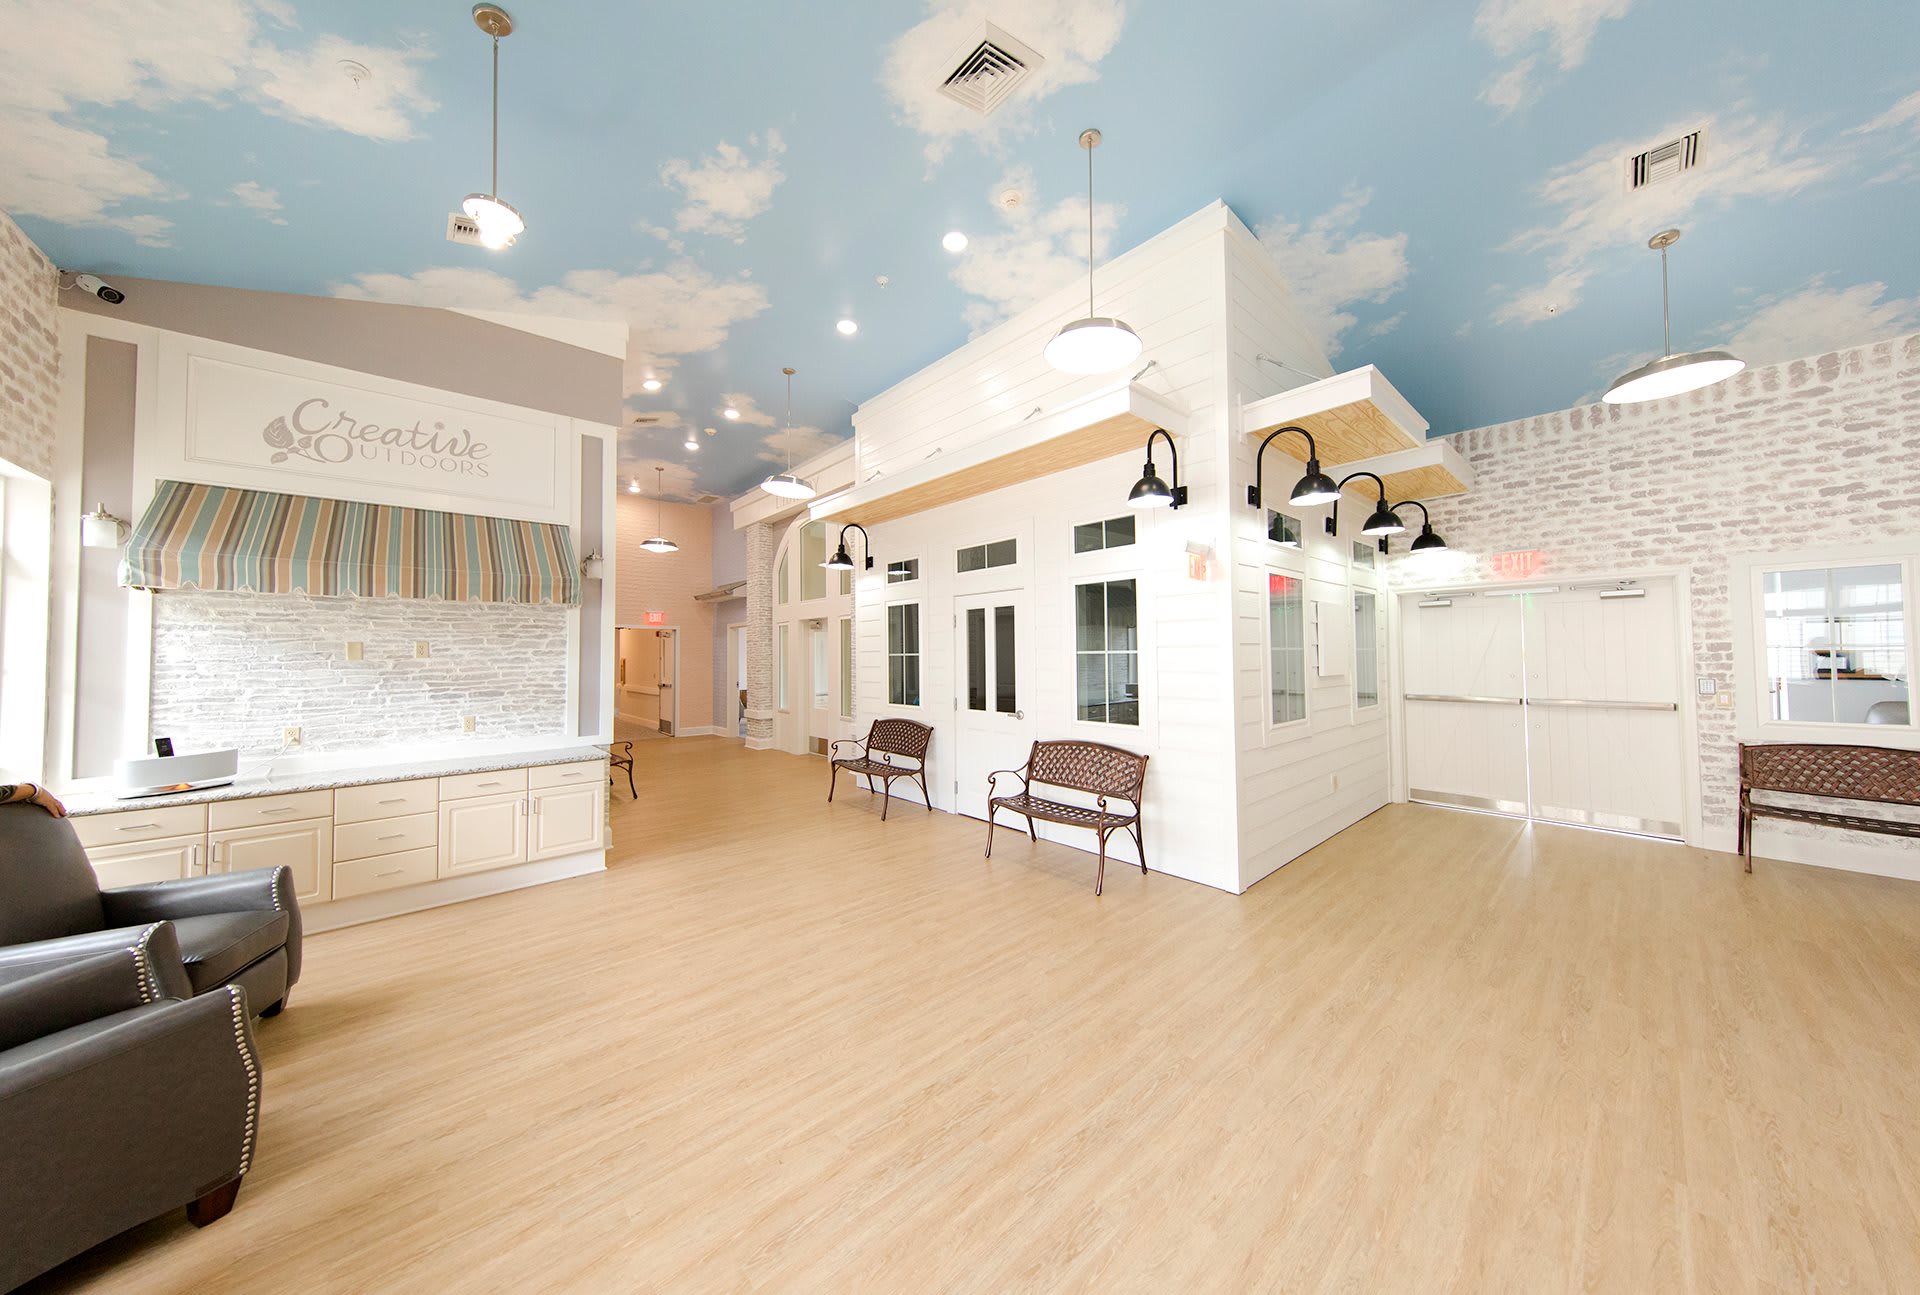
Runk and Pratt Pearls of Life at Liberty Ridge
107 Monica Boulevard, Lynchburg, VA 24502 (4.4 mi from city center)
Memory Care
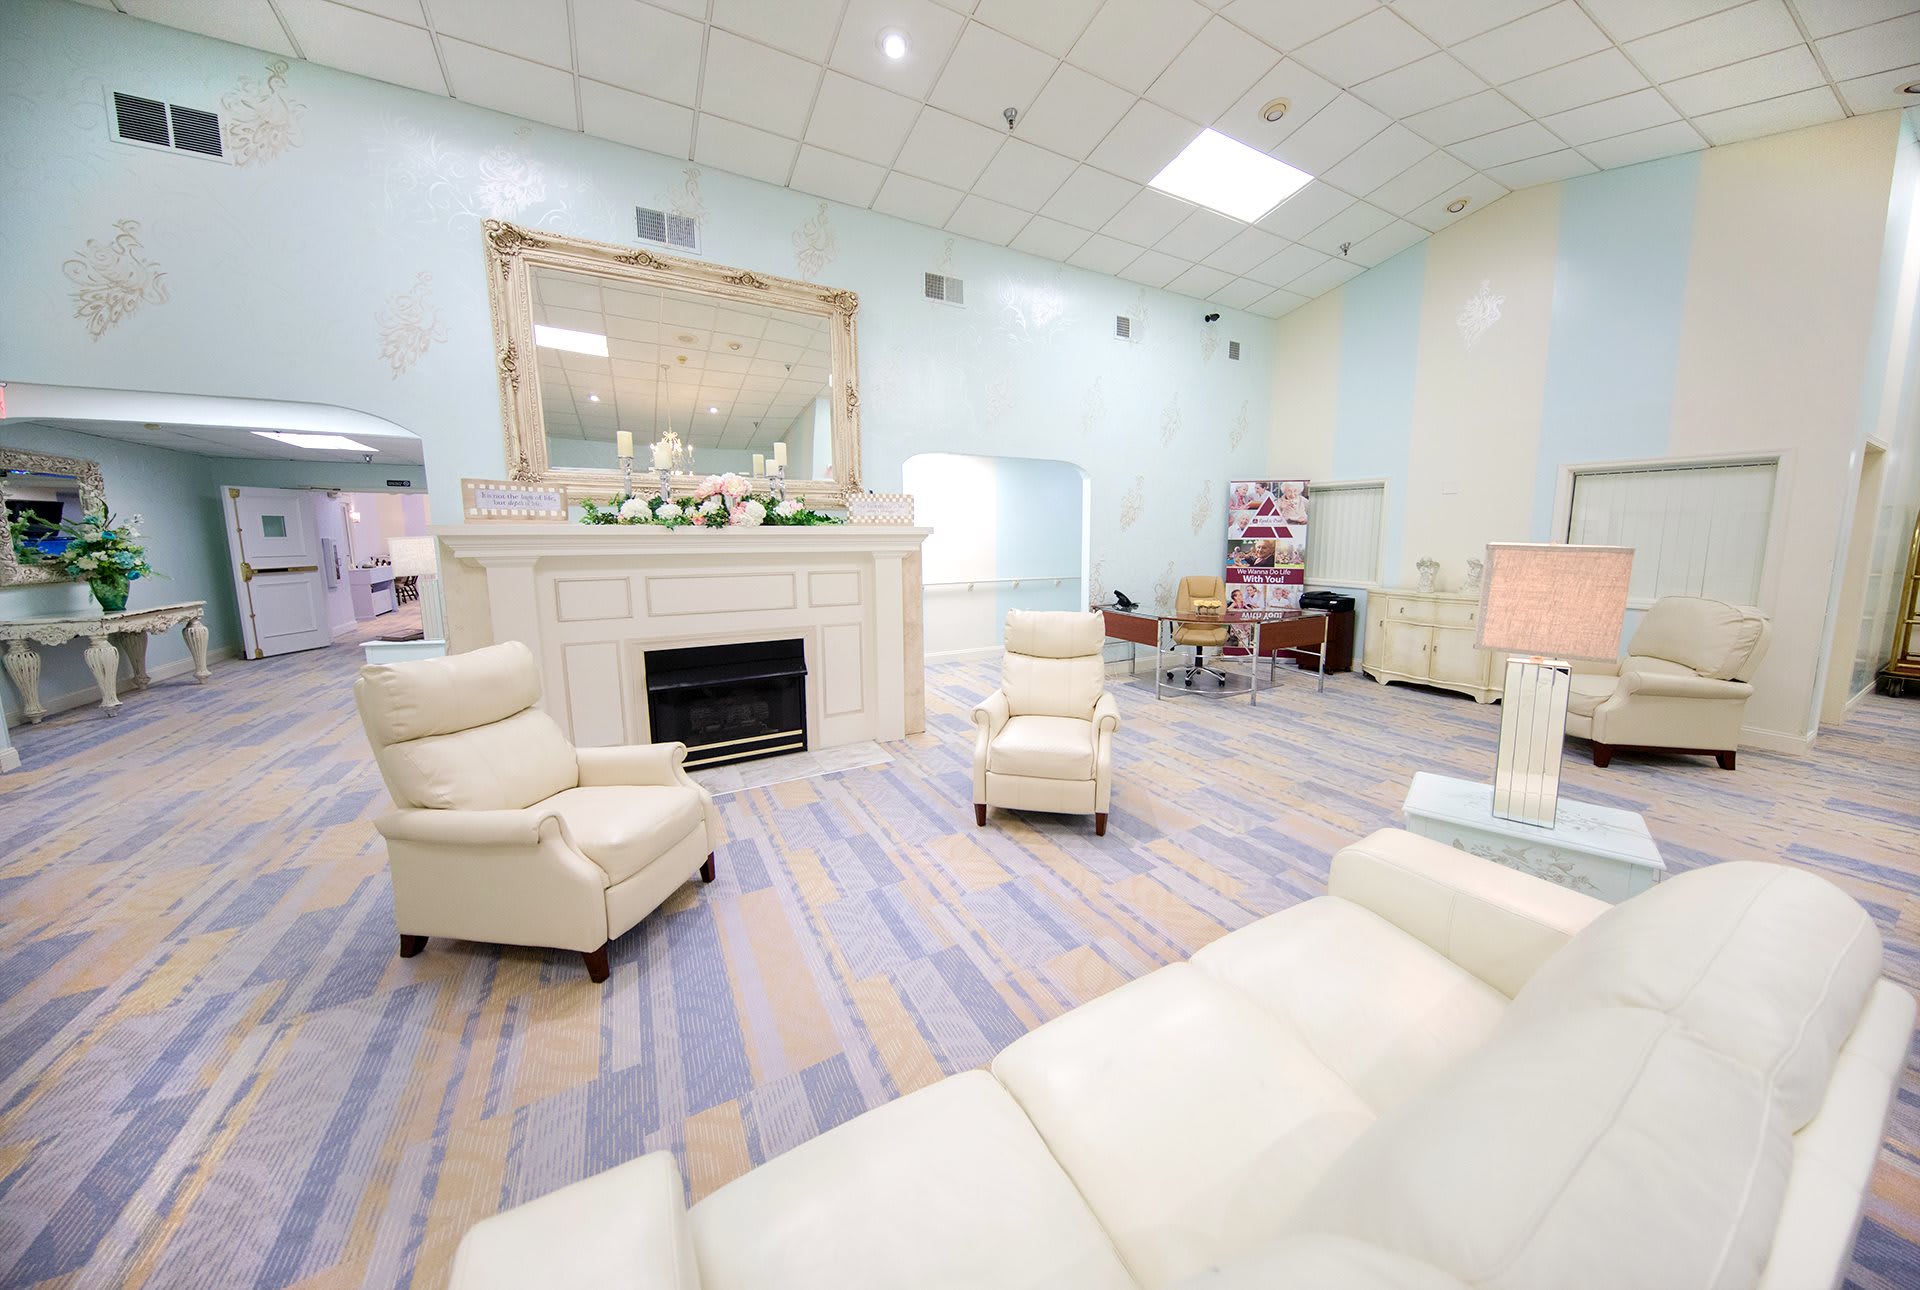
Runk and Pratt at Leesville Road
20212 Leesville Rd, Lynchburg, VA 24502 (5 mi from city center)
Assisted Living
Map of Assisted Living in Lynchburg
Find the right senior living community by location- The Elms of Lynchburg
- First Dominion Home Health Cr
- Bentley Commons at Lynchburg
- Heritage Green and Daybreak
- Runk and Pratt at Liberty Ridge
- Care Advantage of Lynchburg, VA
- Runk and Pratt of Forest
- Runk and Pratt Pearls of Life at Liberty Ridge
- Runk and Pratt at Leesville Road
Senior Living Statistics for Lynchburg, Virginia
Average Senior Living Costs by Housing Type
The cost of senior housing in Lynchburg varies depending on the type of accommodation and level of care. The following is the average monthly cost of senior housing based on data from 2023-2024.
| Housing Type | Average Monthly Cost |
|---|---|
| Assisted Living | $4,034 |
| Memory Care | $4,034 |
| Independent Living | $3,100 |
| Nursing Home: Private Room | $4,776 |
| Nursing Home: Semi-Private Room | $4,487 |
| Nursing Home: Studio | $4,215 |
| Nursing Home: One Bedroom | $4,784 |
| Nursing Home: Two Bedroom | N/A |
| Nursing Home: Detached Cottage | N/A |
Average Cost of Assisted Living in Lynchburg
The following is the average monthly cost of assisted living in Lynchburg based on 2024 data.
| City | Average Monthly Cost |
|---|---|
| Lynchburg | $4,034 |
| Buena Vista | $2,999 |
| Iron Gate | $3,084 |
Here is how the average cost of assisted living in Lynchburg compares to Virginia and the national average:
| Area | Average Monthly Cost |
|---|---|
| Lynchburg | $4,034 |
| Virginia | $5,248 |
| United States | $4,546 |
Senior Living Availability in Lynchburg
Number of senior living facilities in:
8
Lynchburg
14
Surrounding Area
452
Virginia
Lynchburg Senior Demographics
Based on information from 2023, here are some details around the population of Lynchburg, such as age distribution for seniors, and racial diversity.
Population
Lynchburg has a population of 79,166.- 46.7% Male
- 53.3% Female
Marital Status
- 35.6% Married
- 10.6% Divorced
- 48.7% Never Married
- 5% Widowed
Age
Seniors make up about 28.4% of the population.- 9.5% in their 50s
- 8.7% in their 60s
- 6.4% in their 70s
- 3.8% in their 80s
Diversity
- 62.7% White
- 27.6% Black
- 2.2% Asian
- 0.3% Native
- 0.2% Pacific
- 2% Identifying as Other
- 5% Mixed Race
- 4.7% Hispanic
Additional Cities with Assisted Living Near Lynchburg
| City | Average Monthly Cost |
|---|
| City | Average Monthly Cost |
|---|---|
| Bedford | $3,998 |
