Best Assisted Living Facilities in Wichita Falls, TX
Find local assisted living and retirement communities in the Wichita Falls, TX area.
4 Communities were found near Wichita Falls, TX
City
Care Type
- Adult Day Services
- Assisted Living
- Home Care
- Independent Living
- Memory Care
- Nursing Home
- Residential Care Home
- Senior Apartments
- Distance from City Center
- Highest Rating
- Name: A - Z
- Name: Z - A

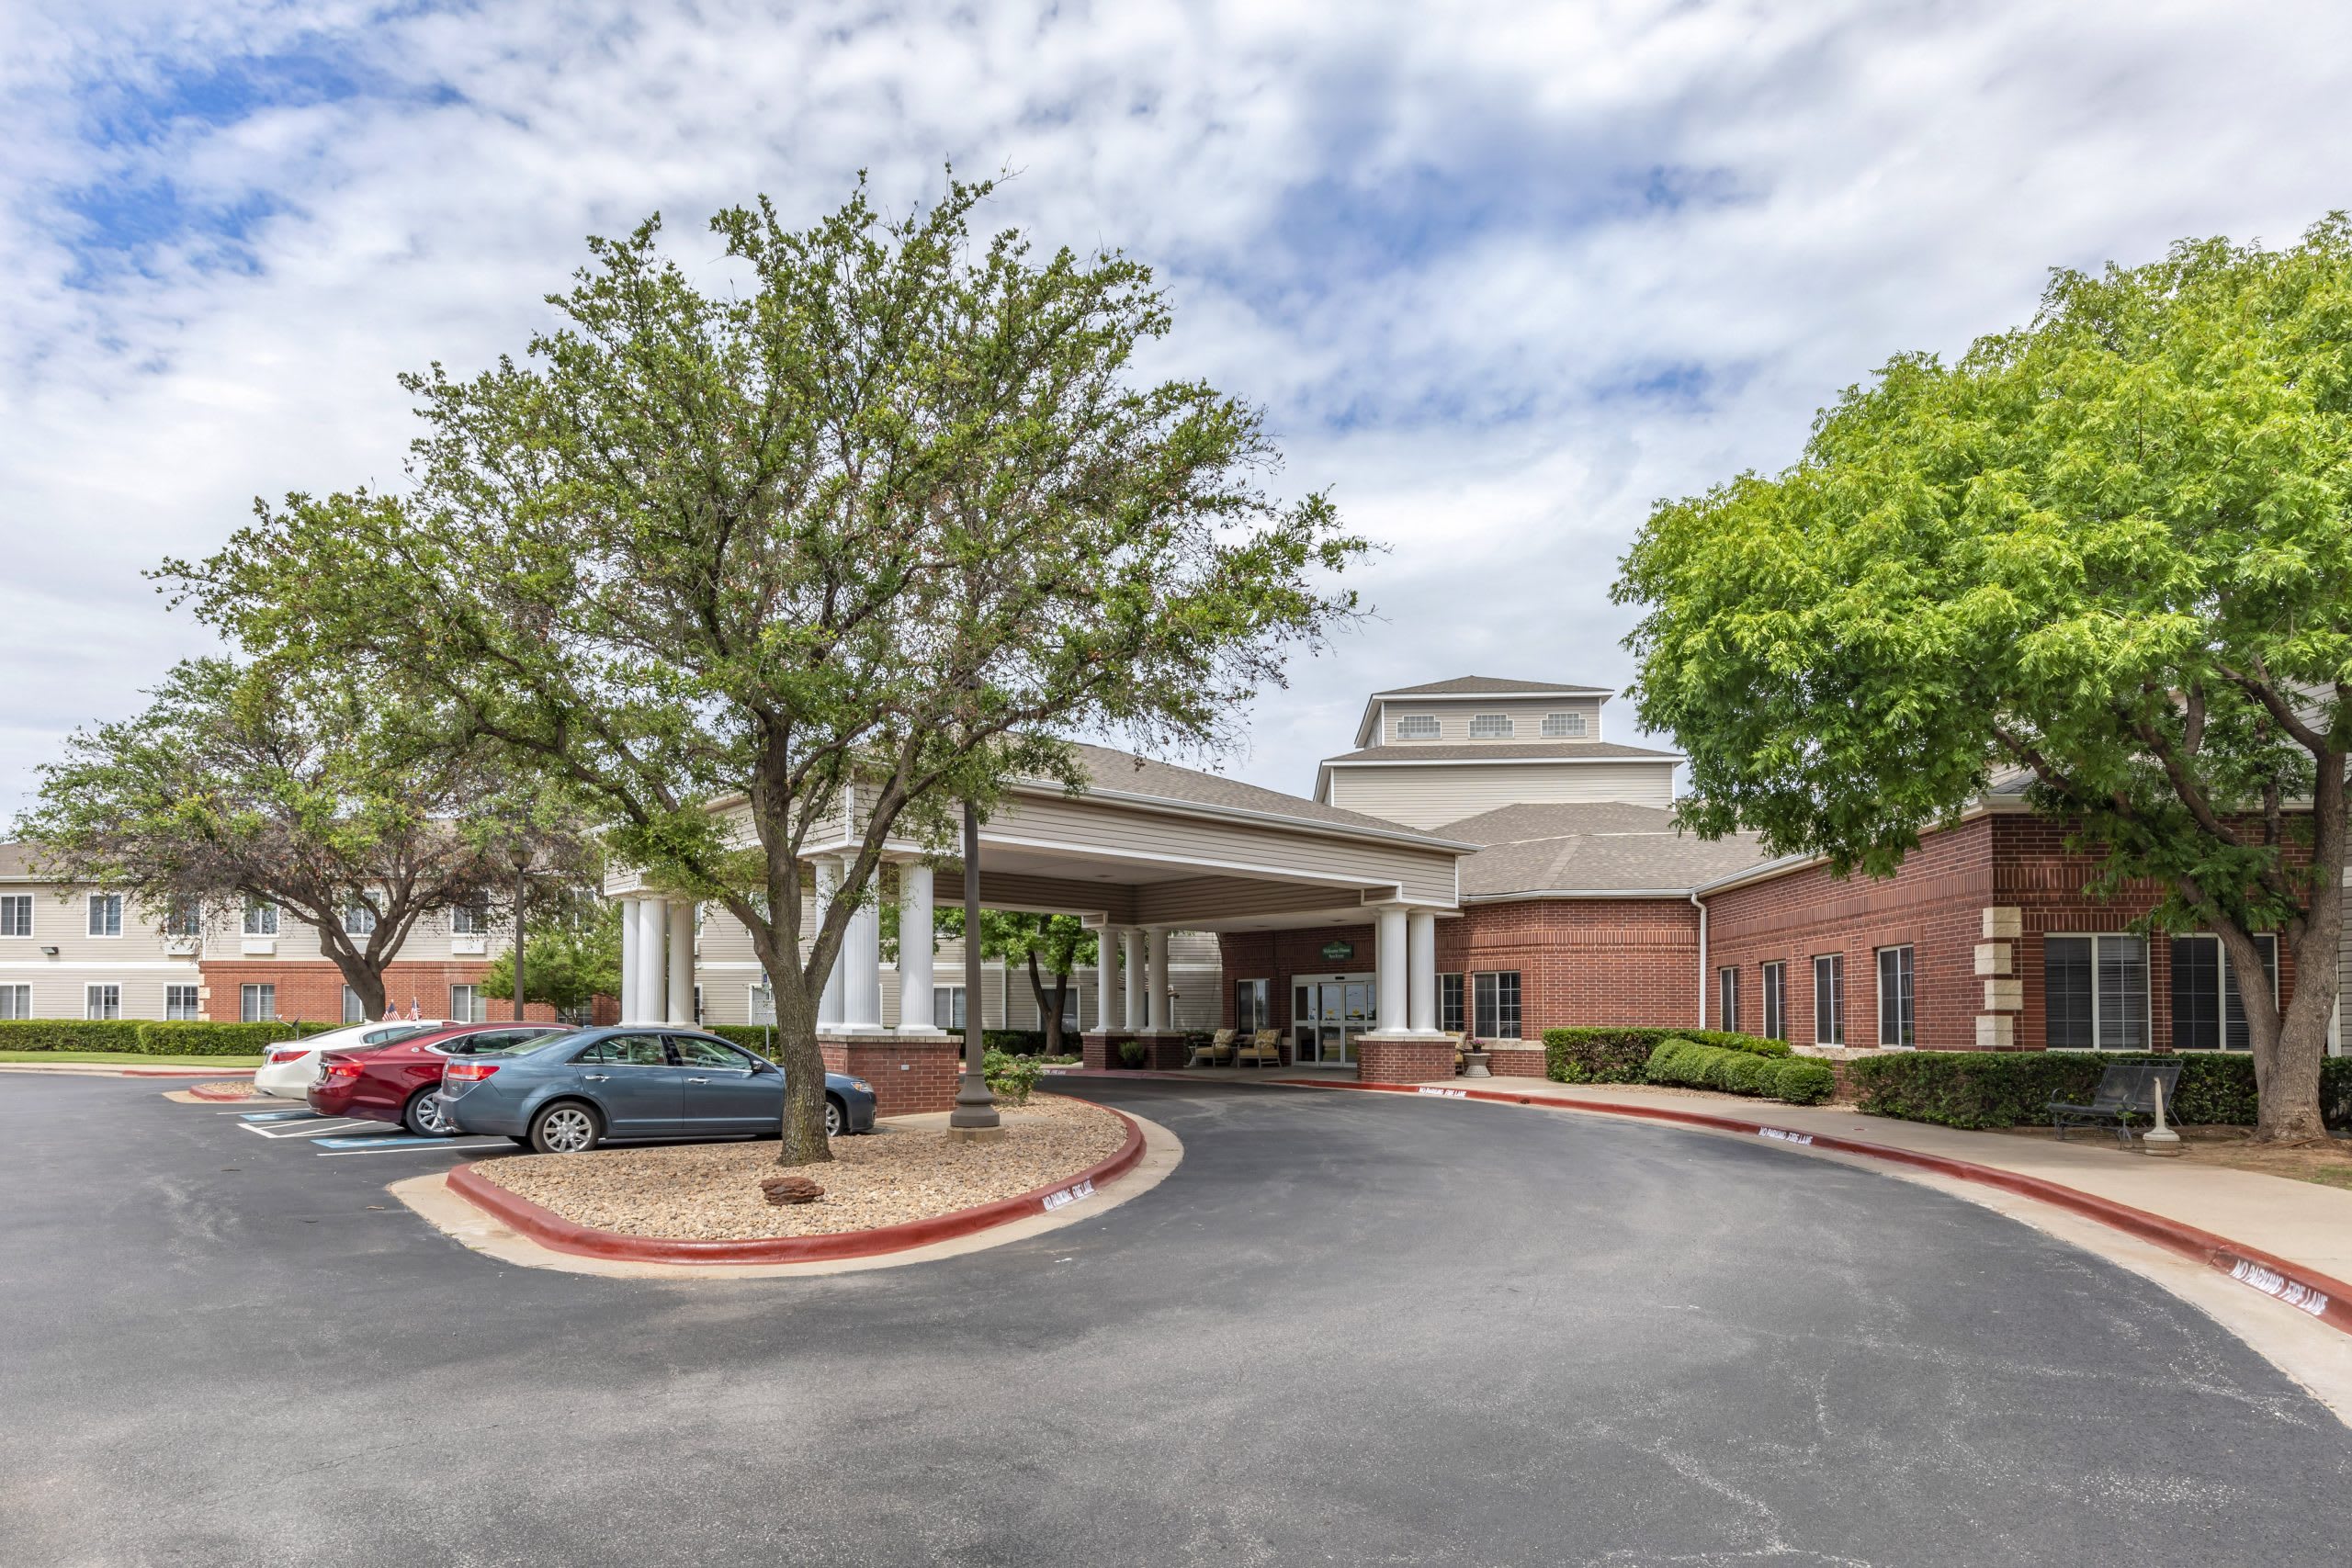
Royal Estates of Wichita Falls
3908 Kell Boulevard West, Wichita Falls, TX 76309 (2 mi from city center)
Independent Living

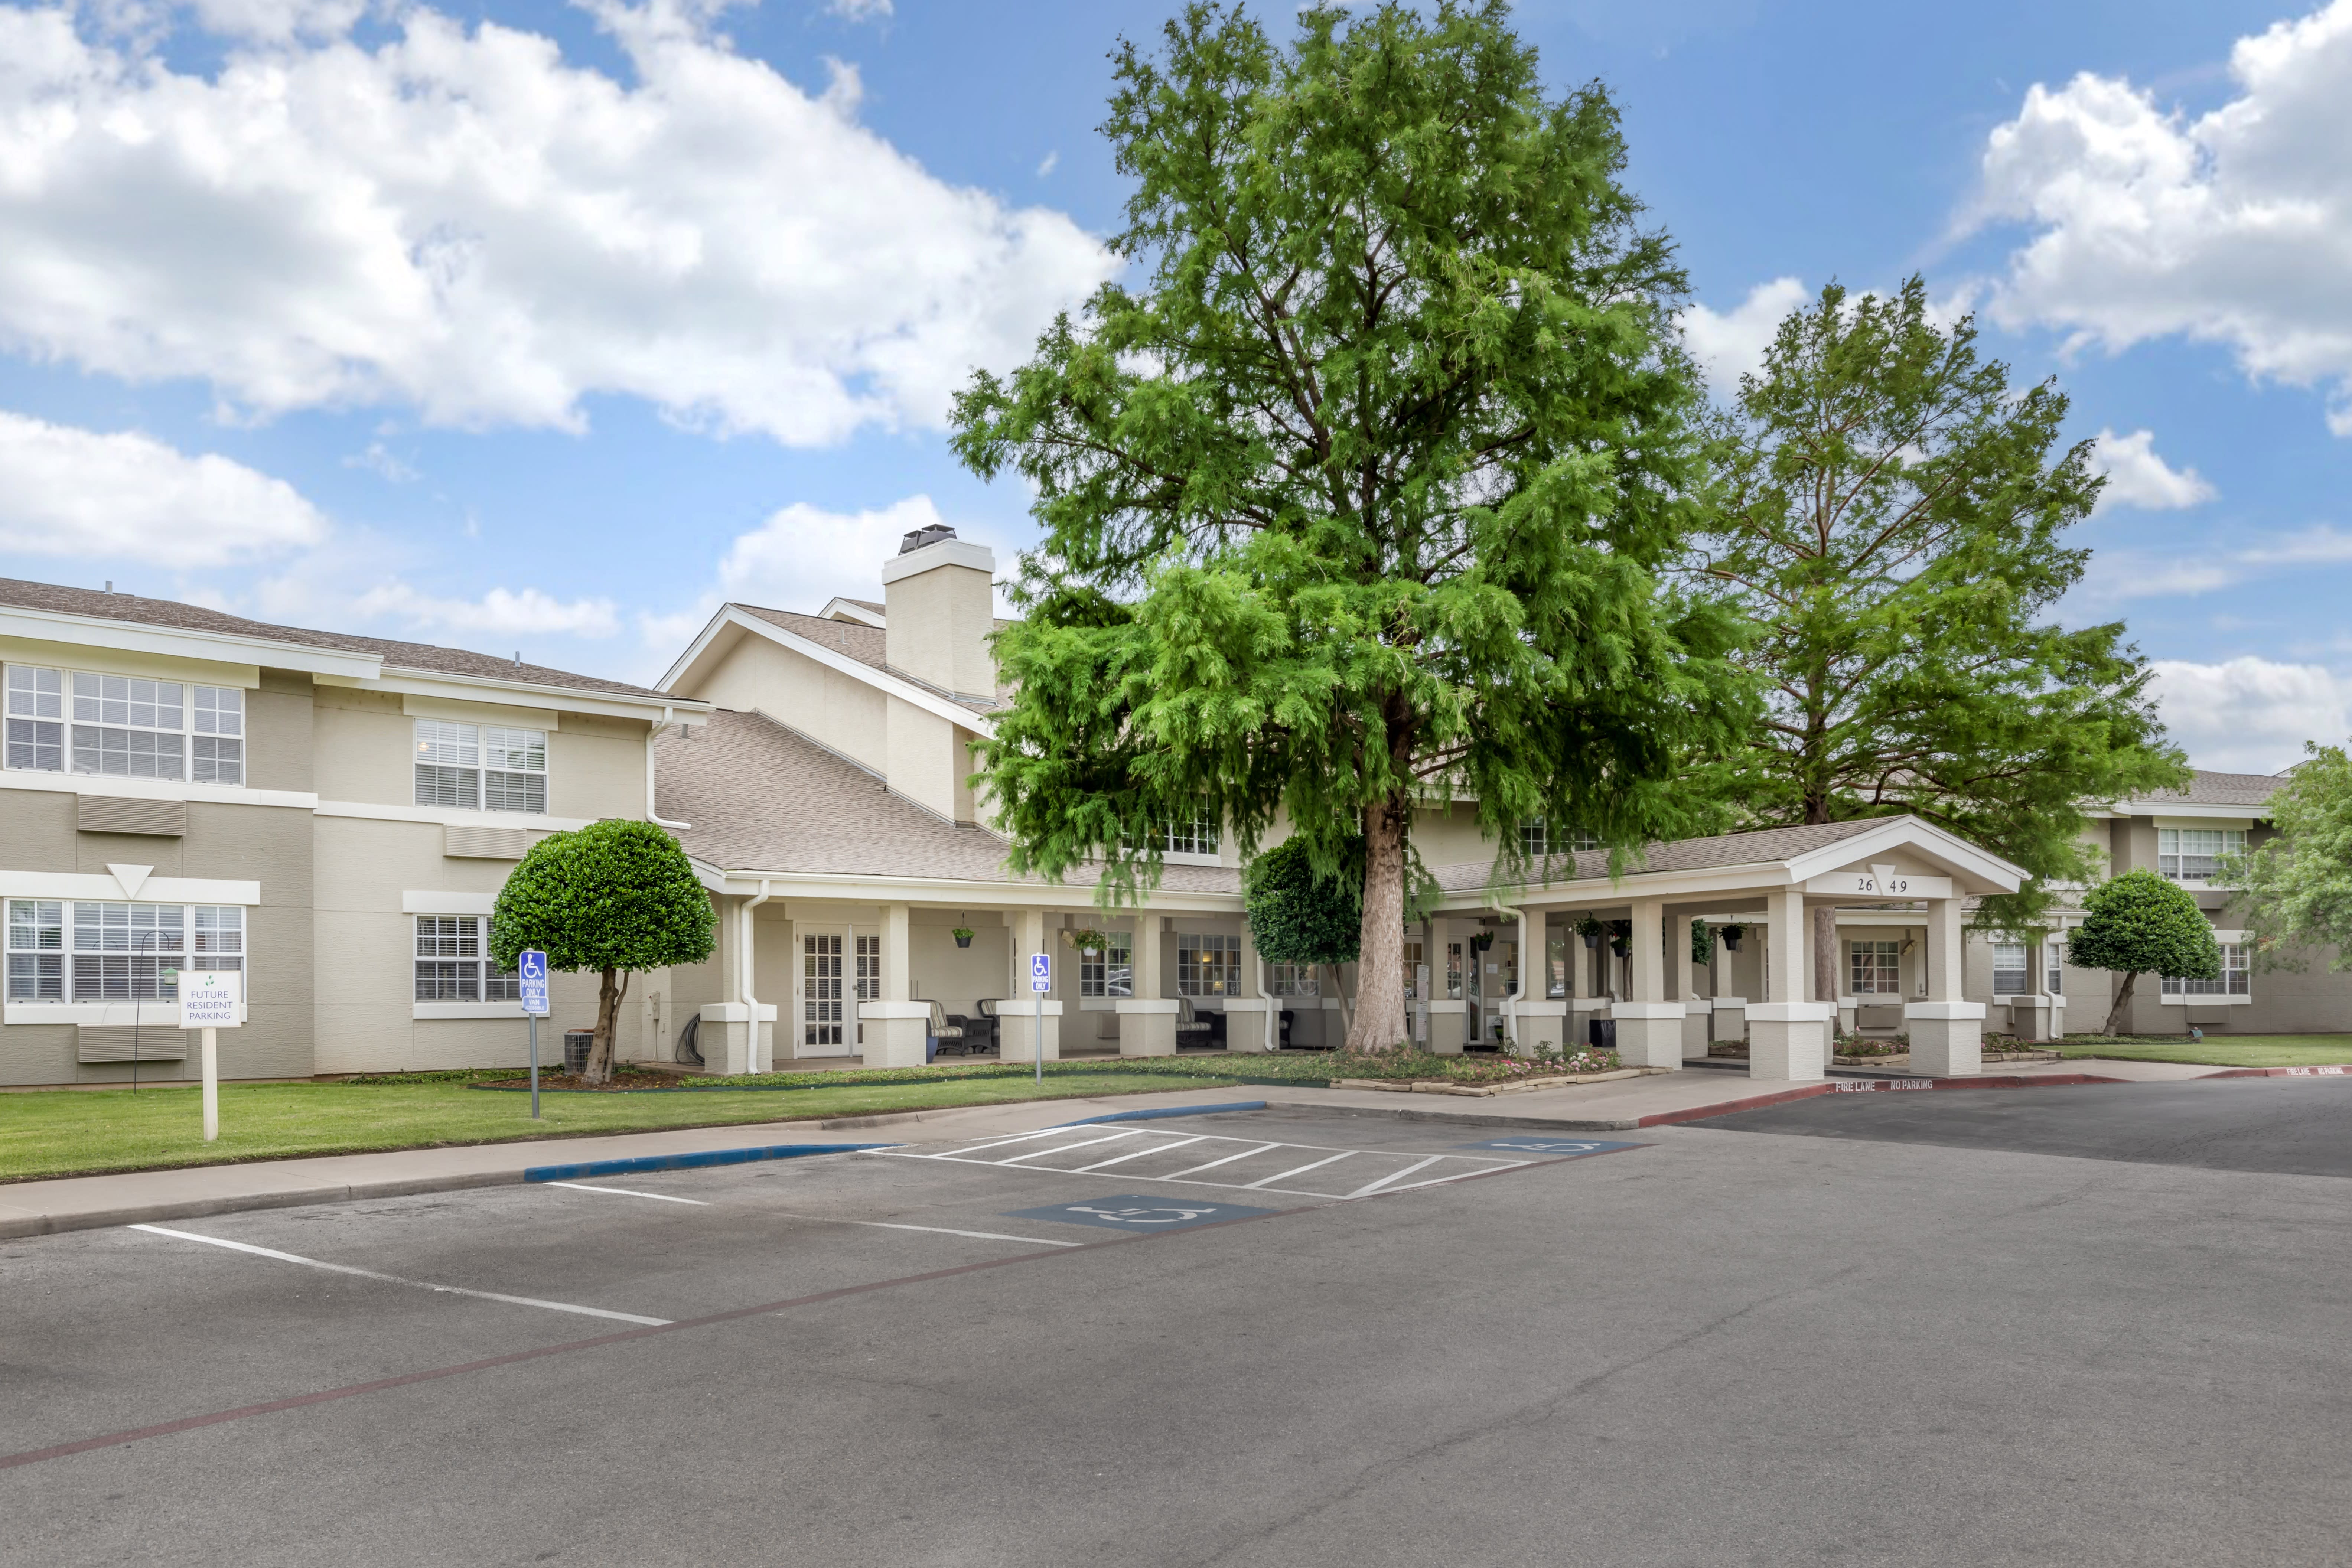
Brookdale Sikes Lake
2649 Plaza Parkway, Wichita Falls, TX 76308 (2.8 mi from city center)
Assisted Living

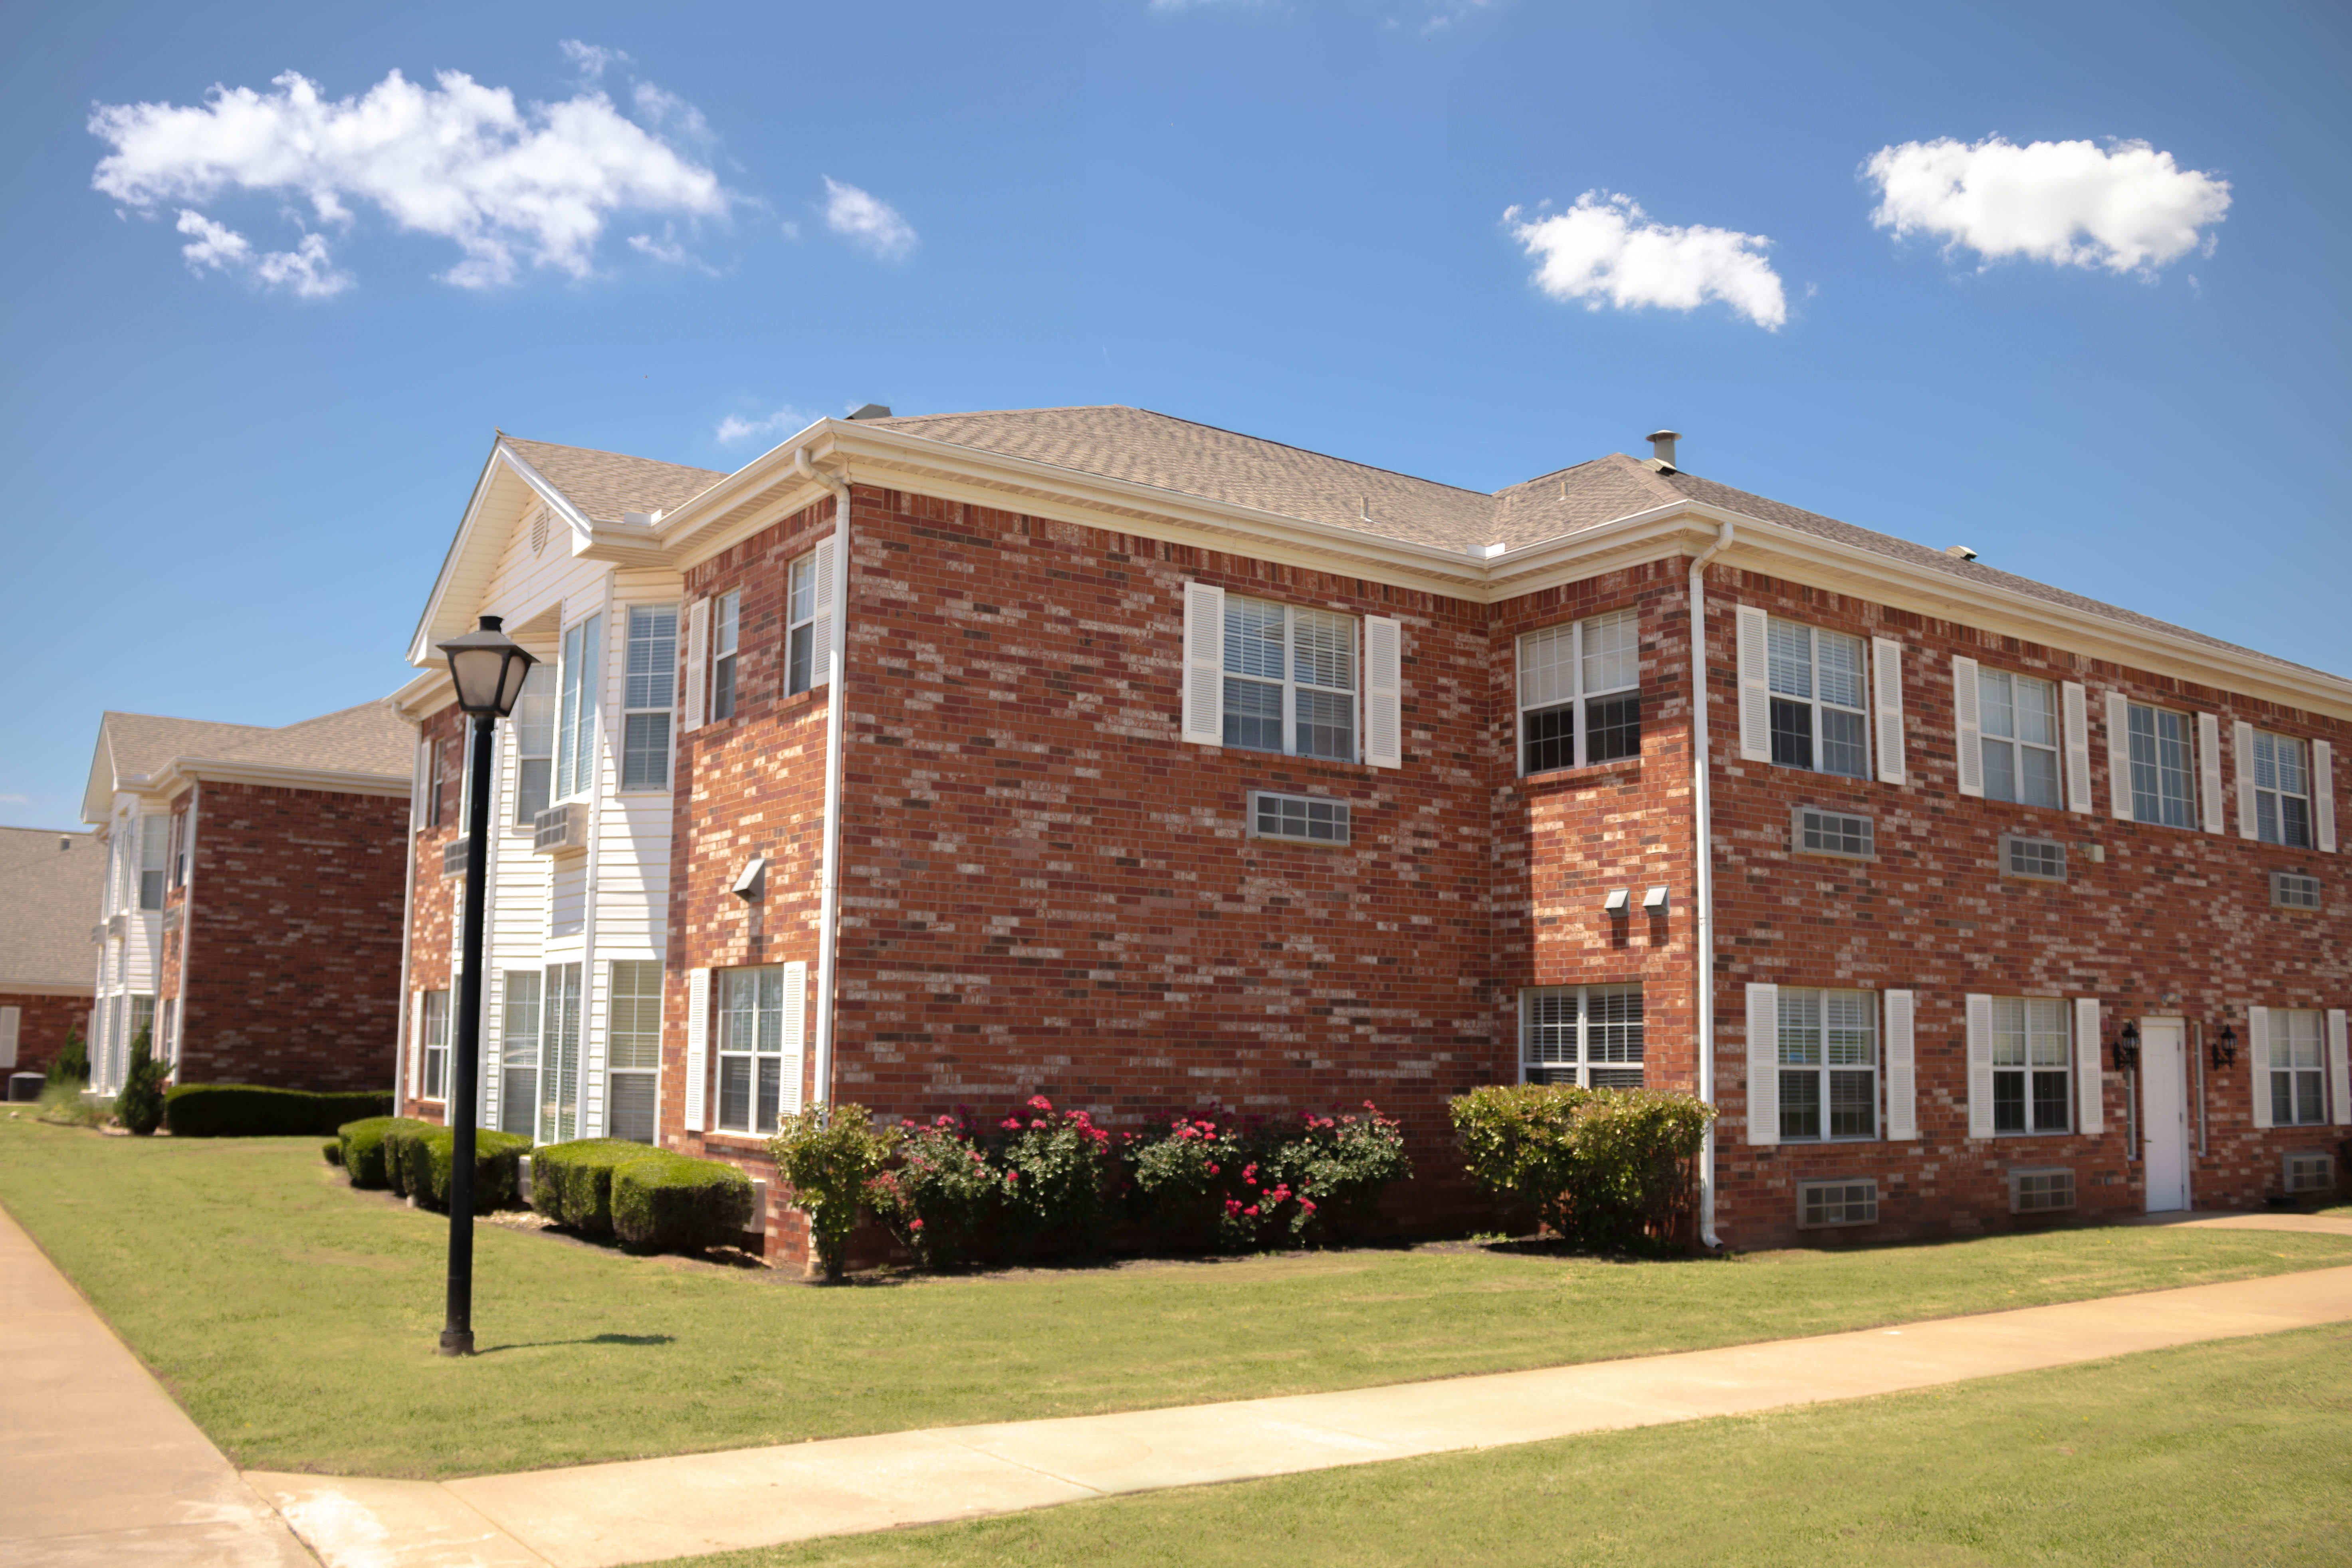
Elison of Lake Wellington
5100 Kell W Blvd, Wichita Falls, TX 76310 (3.4 mi from city center)
Assisted Living

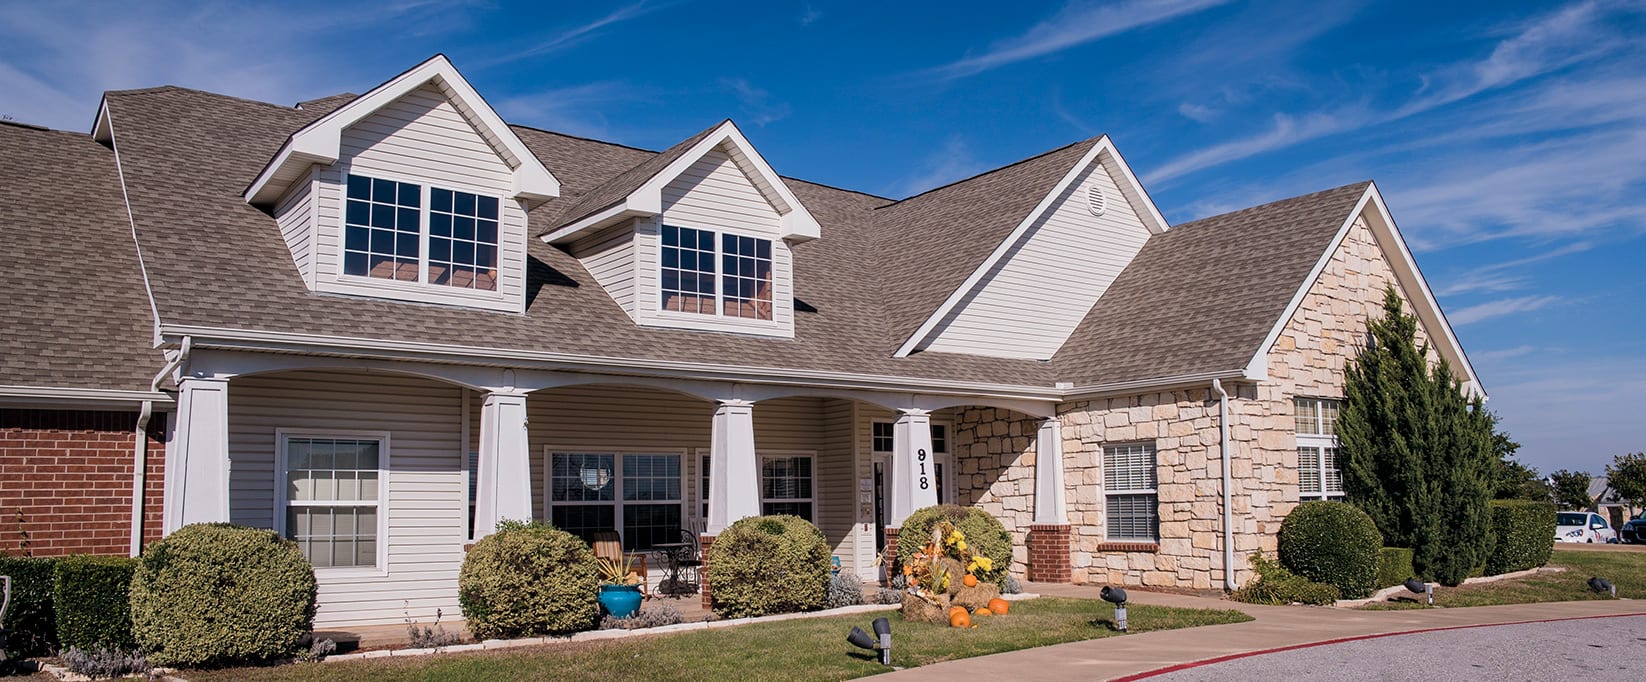
Brookdale Midwestern
918 Midwestern Parkway, Wichita Falls, TX 76302 (3.4 mi from city center)
Assisted Living
Map of Assisted Living in Wichita Falls
Find the right senior living community by location- Royal Estates of Wichita Falls
- Brookdale Sikes Lake
- Elison of Lake Wellington
- Brookdale Midwestern
Senior Living Statistics for Wichita Falls, Texas
Average Senior Living Costs by Housing Type
The cost of senior housing in Wichita Falls varies depending on the type of accommodation and level of care. The following is the average monthly cost of senior housing based on data from 2023-2024.
| Housing Type | Average Monthly Cost |
|---|---|
| Assisted Living | $3,904 |
| Memory Care | $3,904 |
| Independent Living | $3,592 |
| Nursing Home: Private Room | $3,634 |
| Nursing Home: Semi-Private Room | $2,865 |
| Nursing Home: Studio | $4,388 |
| Nursing Home: One Bedroom | $4,000 |
| Nursing Home: Two Bedroom | N/A |
| Nursing Home: Detached Cottage | N/A |
Average Cost of Assisted Living in Wichita Falls
The following is the average monthly cost of assisted living in Wichita Falls based on 2024 data.
| City | Average Monthly Cost |
|---|---|
| Wichita Falls | $3,904 |
| Nocona | $3,318 |
| Jolly | $3,284 |
Here is how the average cost of assisted living in Wichita Falls compares to Texas and the national average:
| Area | Average Monthly Cost |
|---|---|
| Wichita Falls | $3,904 |
| Texas | $4,628 |
| United States | $4,546 |
Senior Living Availability in Wichita Falls
Number of senior living facilities in:
4
Wichita Falls
4
Surrounding Area
1507
Texas
Wichita Falls Senior Demographics
Based on information from 2023, here are some details around the population of Wichita Falls, such as age distribution for seniors, and racial diversity.
Population
Wichita Falls has a population of 102,482.- 52.4% Male
- 47.6% Female
Marital Status
- 41.9% Married
- 14.4% Divorced
- 37.9% Never Married
- 5.8% Widowed
Age
Seniors make up about 29.9% of the population.- 10.4% in their 50s
- 10% in their 60s
- 6.1% in their 70s
- 3.4% in their 80s
Diversity
- 72.3% White
- 12.4% Black
- 2.7% Asian
- 0.8% Native
- 0.1% Pacific
- 3.5% Identifying as Other
- 8.1% Mixed Race
- 22.3% Hispanic
