Best Assisted Living Facilities in Kerrville, TX
Find local assisted living and retirement communities in the Kerrville, TX area.
5 Communities were found near Kerrville, TX
City
Care Type
- Adult Day Services
- Assisted Living
- Home Care
- Independent Living
- Memory Care
- Nursing Home
- Residential Care Home
- Senior Apartments
- Distance from City Center
- Highest Rating
- Name: A - Z
- Name: Z - A
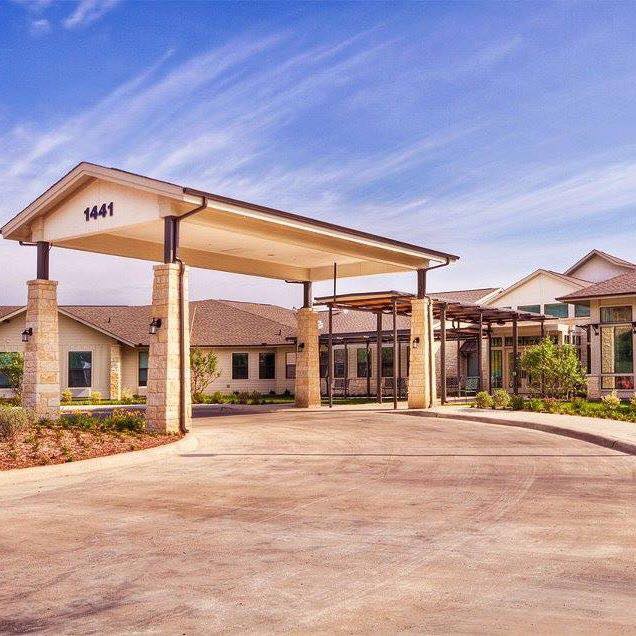
River Point of Kerrville
1441 Bandera Highway, Kerrville, TX 78028 (0.8 mi from city center)
Assisted Living
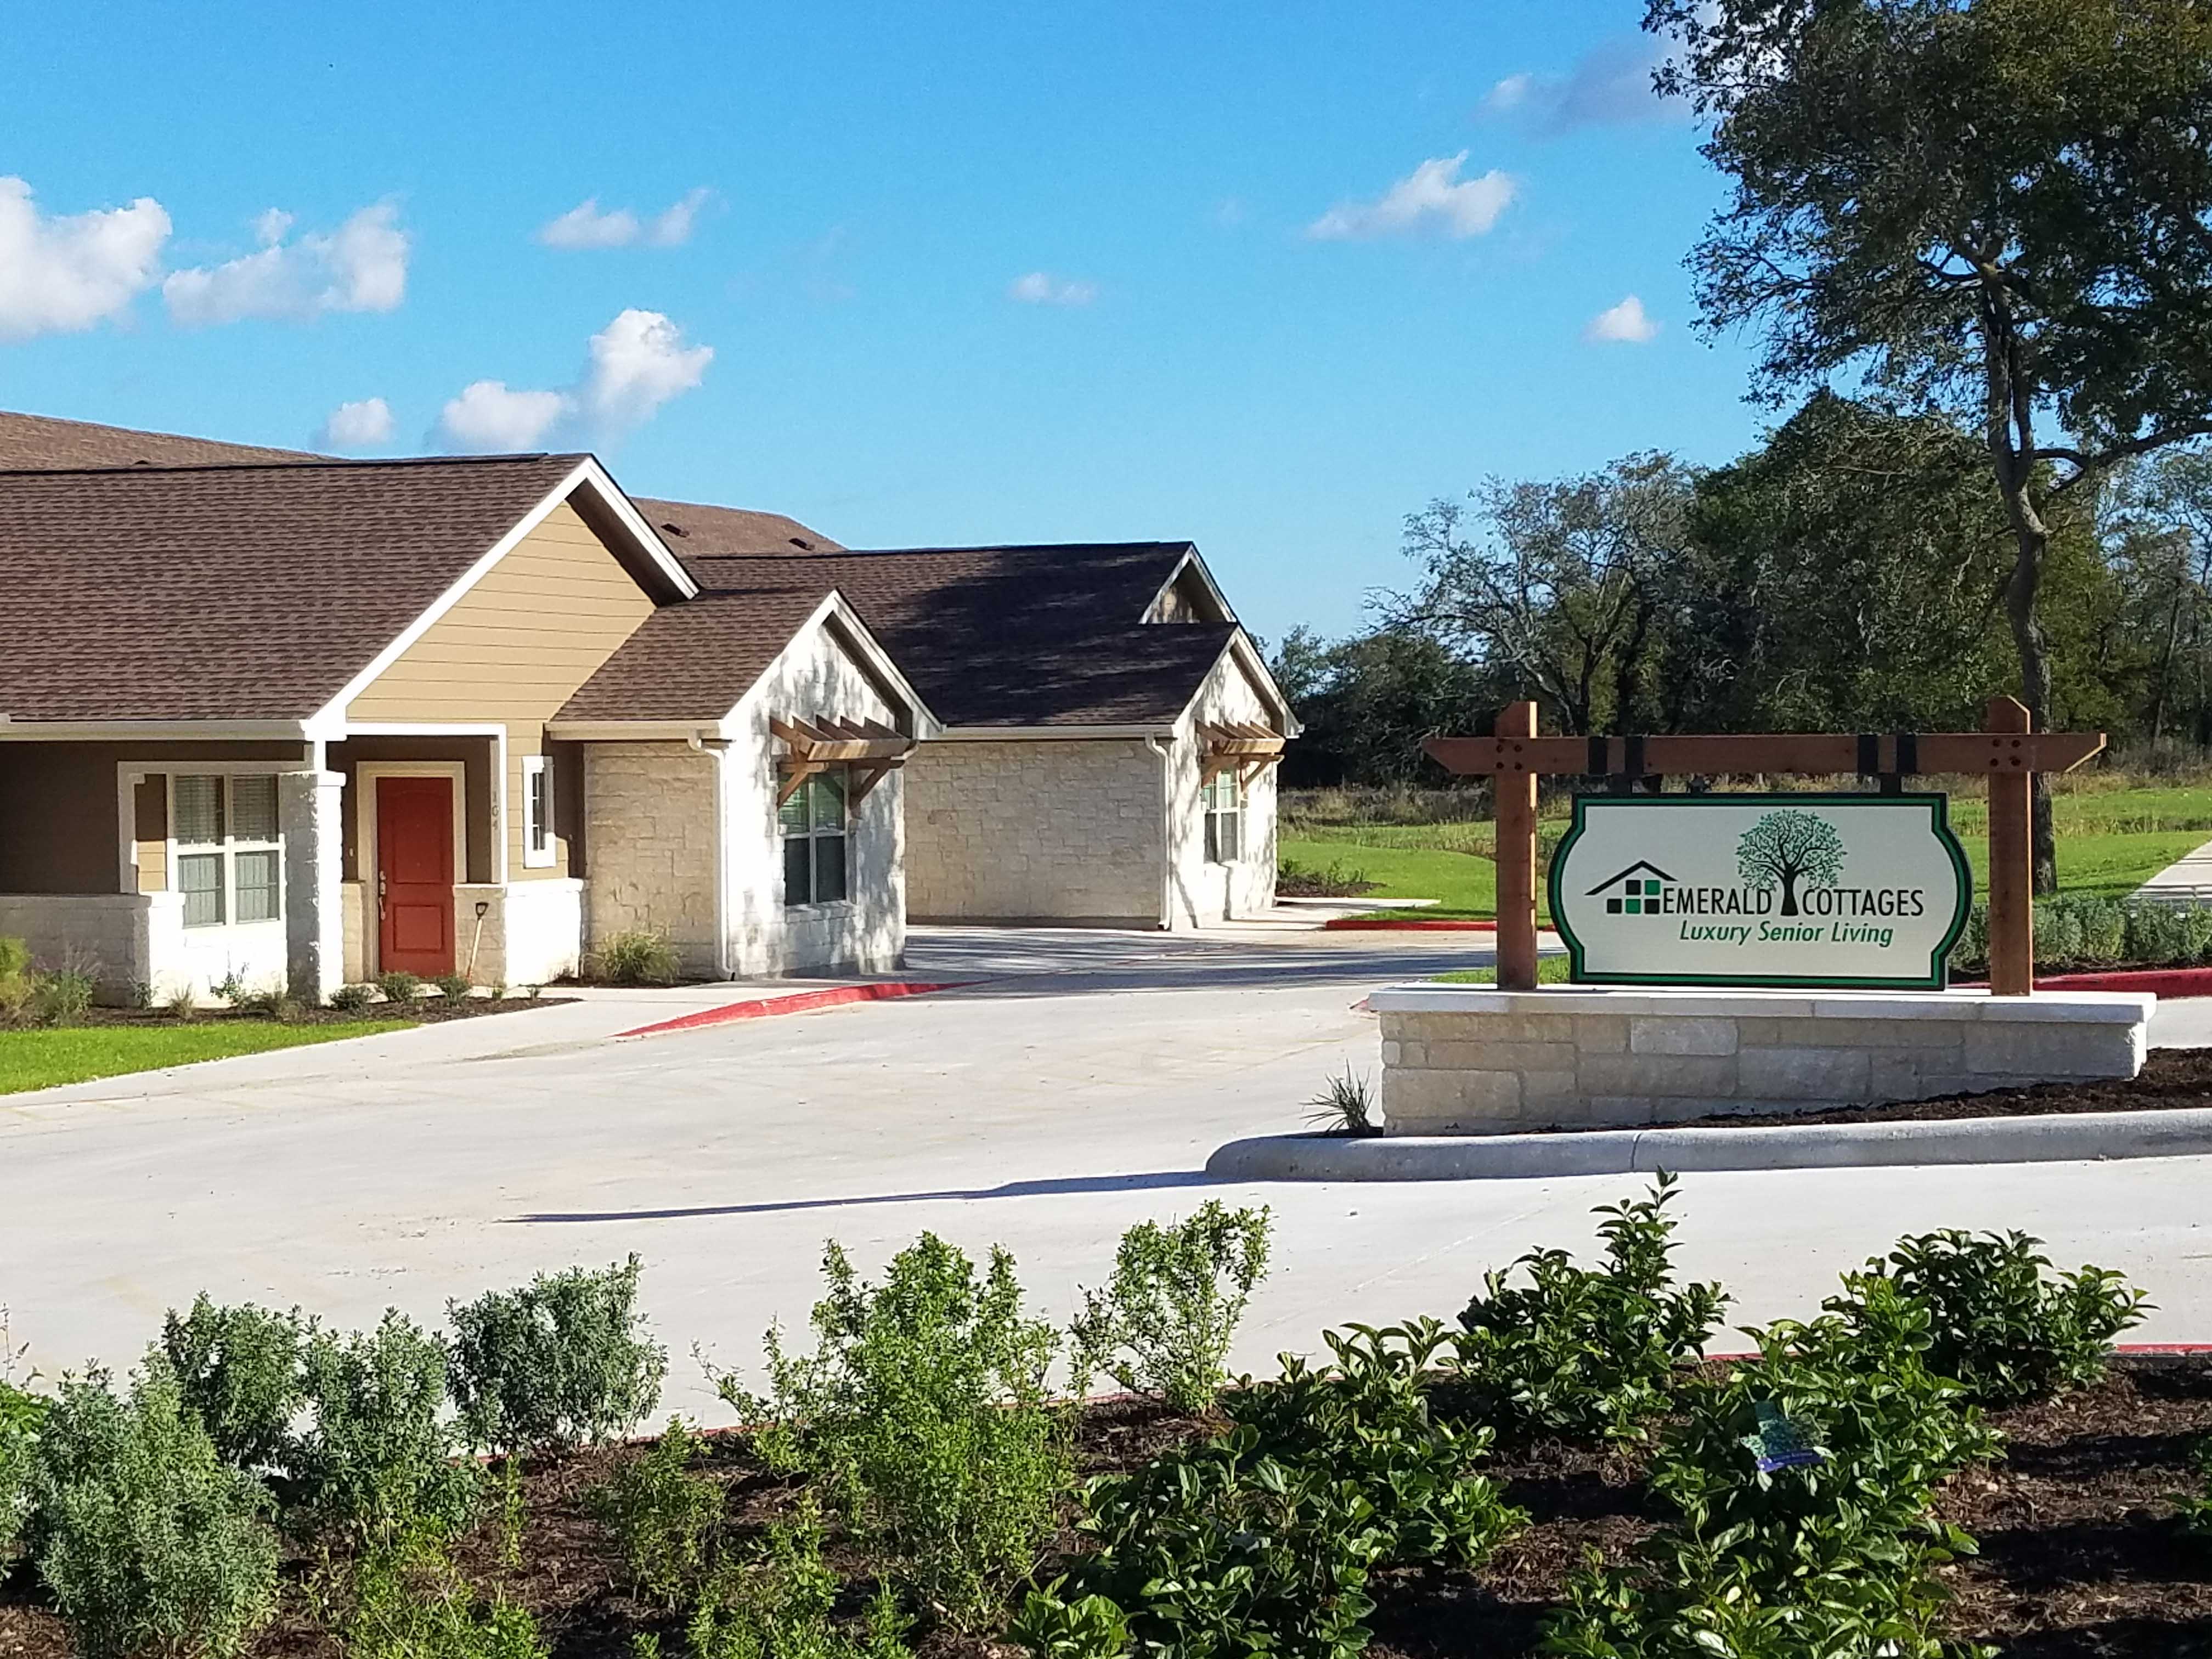
Emerald Cottages of Kerrville
1501 Bandera Highway, Kerrville, TX 78028 (0.9 mi from city center)
Independent Living
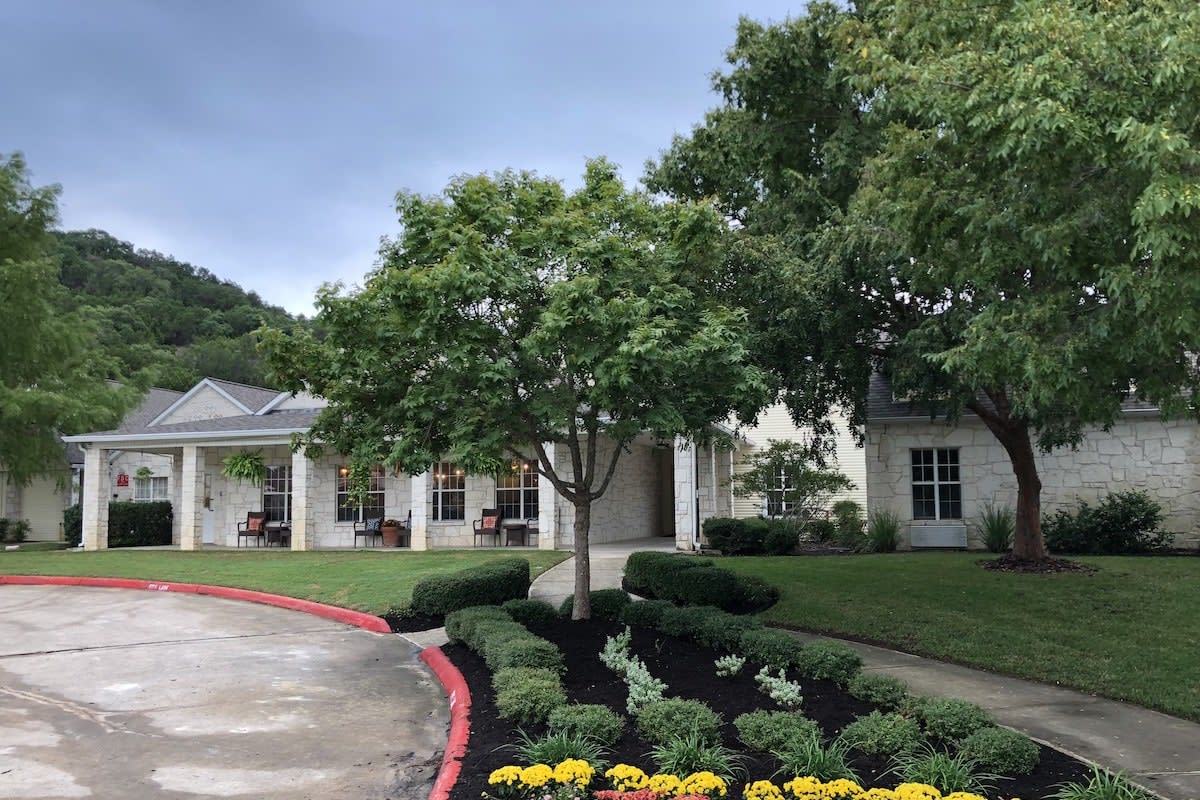
New Haven Memory Care of Kerrville
747 Alpine Dr., Kerrville, TX 78028 (2.1 mi from city center)
Memory Care
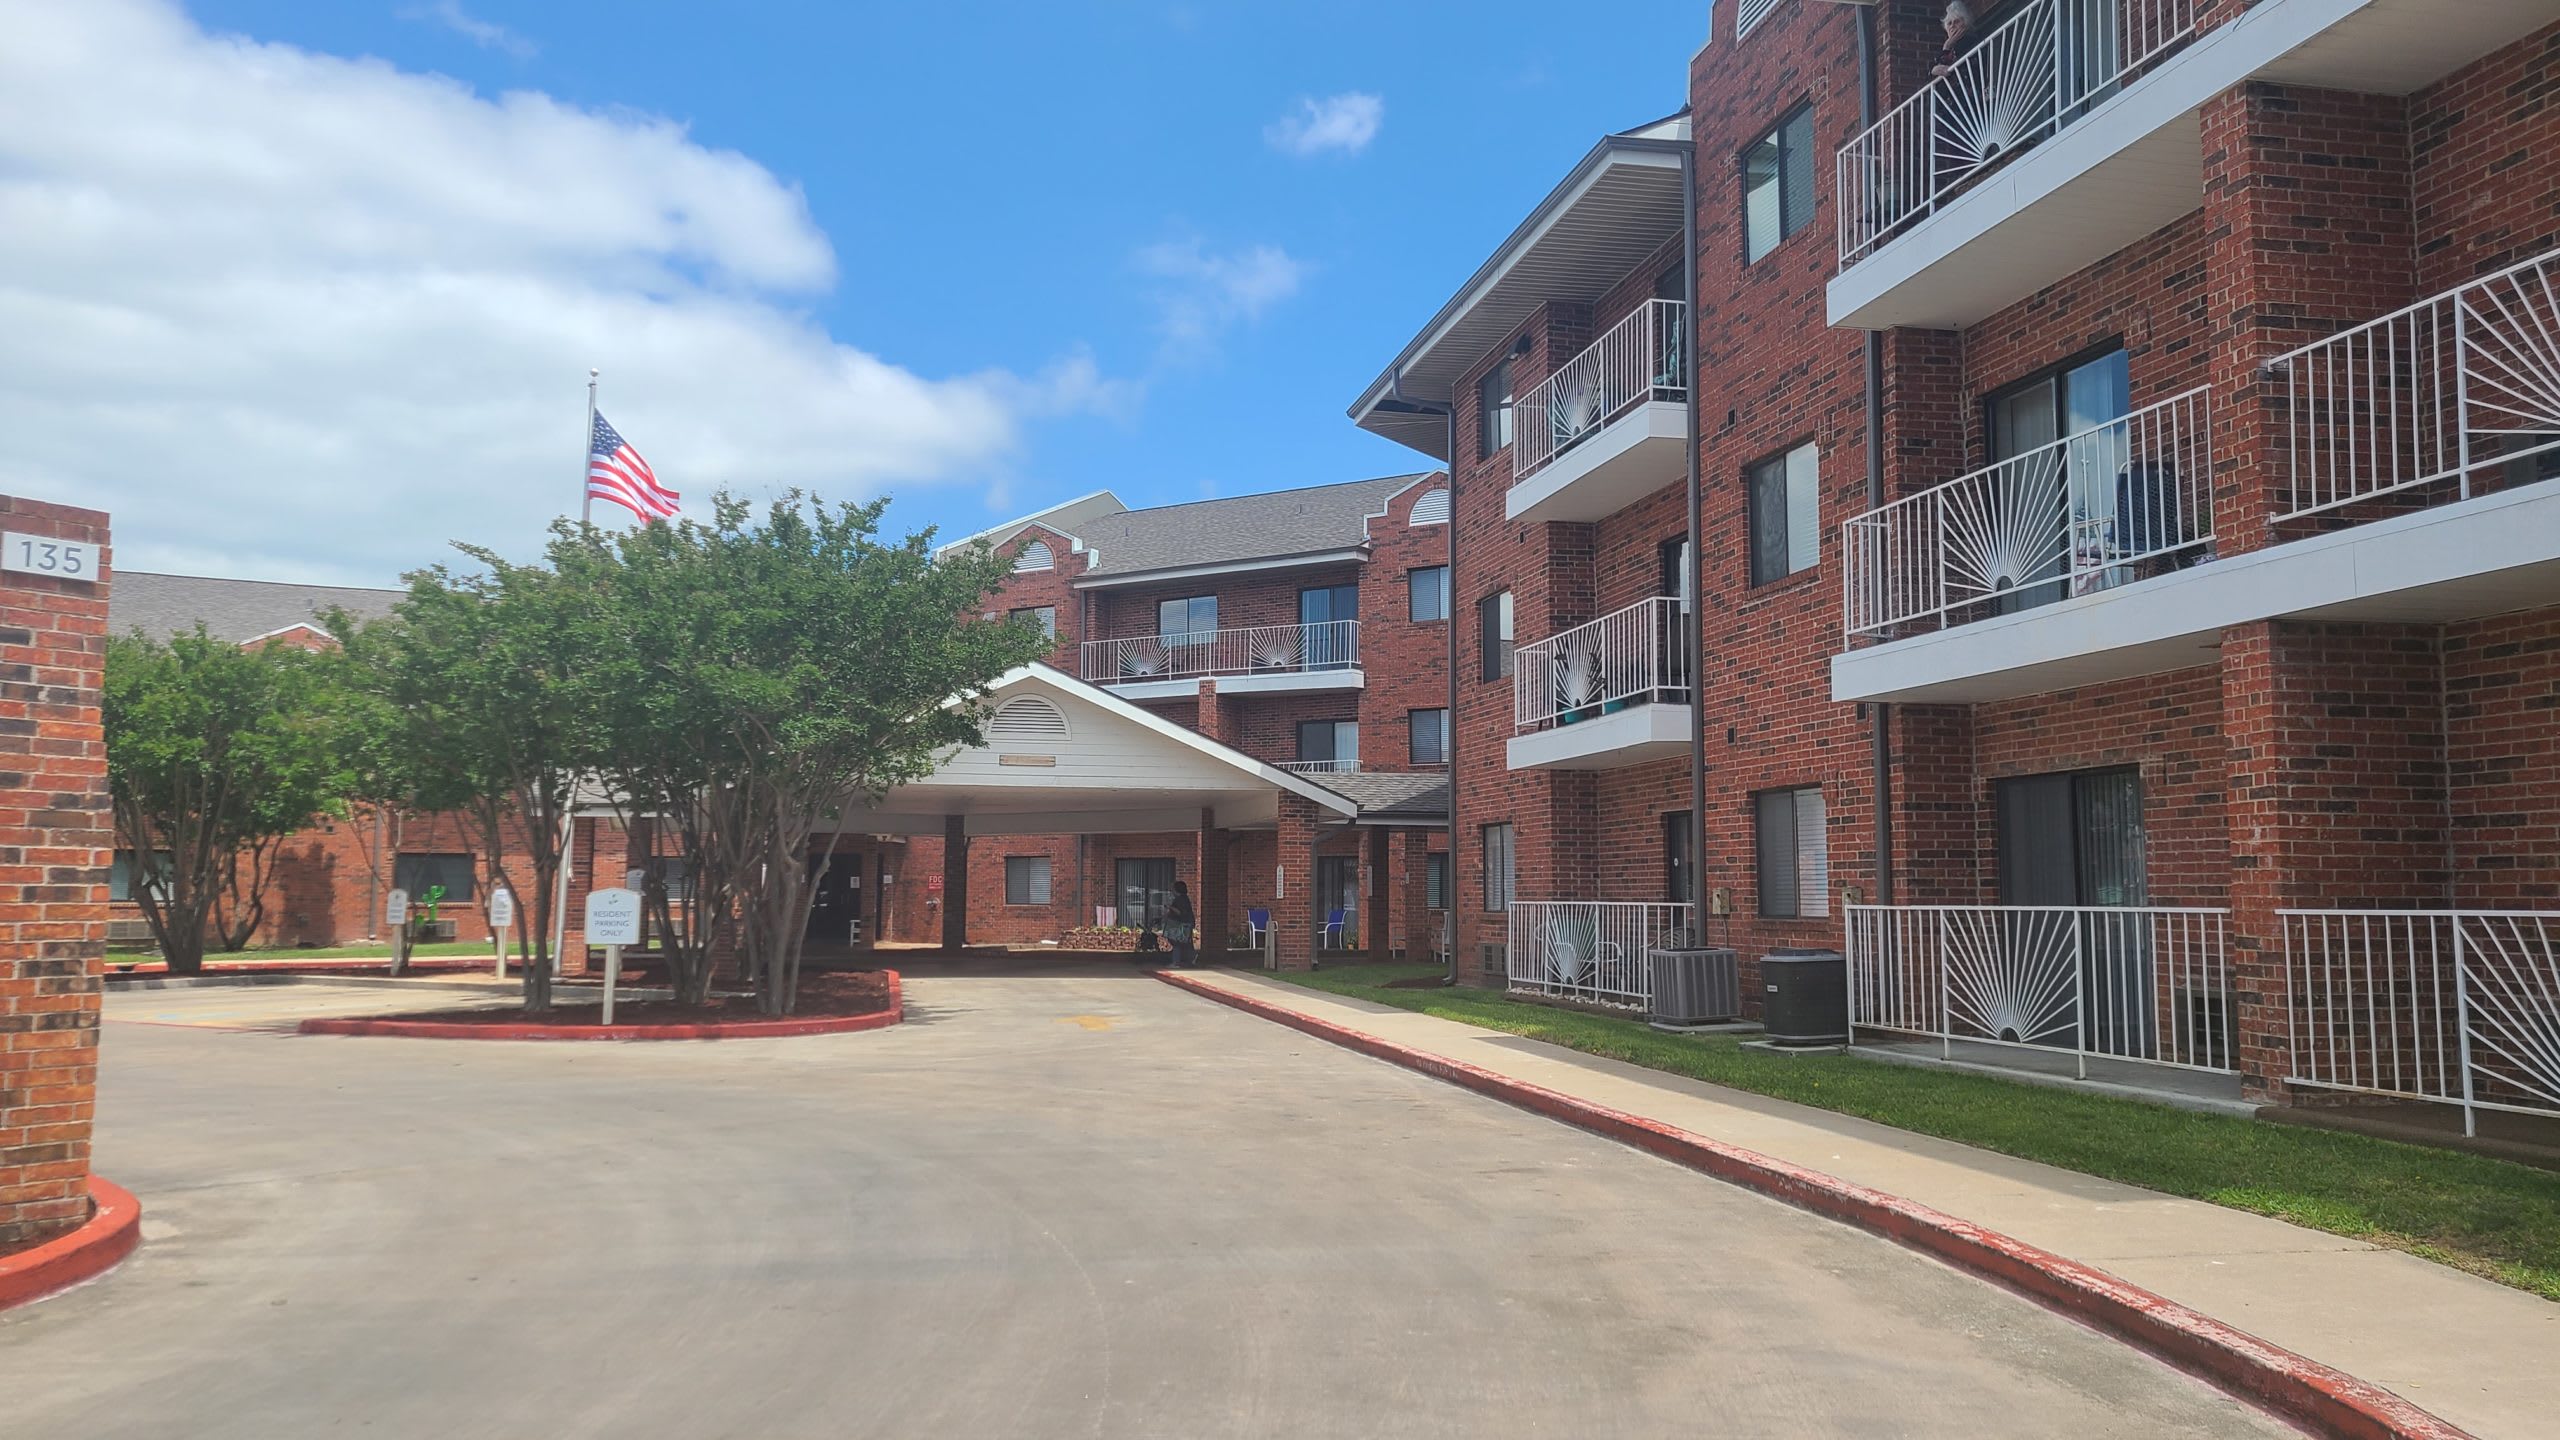
Juniper Village at Guadalupe Riverfront
135 Plaza Dr, Kerrville, TX 78028 (2.2 mi from city center)
Assisted Living
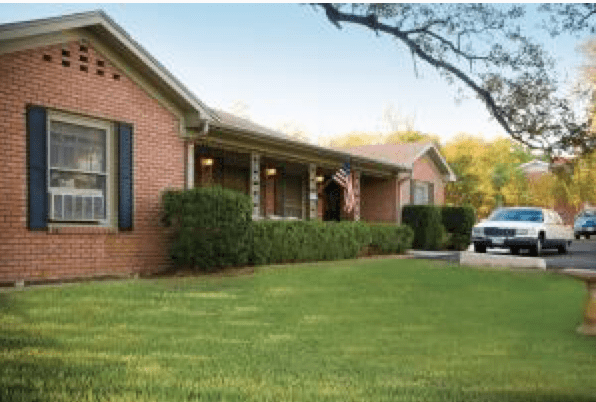
220 Harper
220 Harper Rd, Kerrville, TX 78028 (2.3 mi from city center)
Residential Care Home
Map of Assisted Living in Kerrville
Find the right senior living community by location- River Point of Kerrville
- Emerald Cottages of Kerrville
- New Haven Memory Care of Kerrville
- Juniper Village at Guadalupe Riverfront
- 220 Harper
Senior Living Statistics for Kerrville, Texas
Average Senior Living Costs by Housing Type
The cost of senior housing in Kerrville varies depending on the type of accommodation and level of care. The following is the average monthly cost of senior housing based on data from 2023-2024.
| Housing Type | Average Monthly Cost |
|---|---|
| Assisted Living | $4,589 |
| Memory Care | $4,589 |
| Independent Living | $4,222 |
| Nursing Home: Private Room | $4,340 |
| Nursing Home: Semi-Private Room | $4,950 |
| Nursing Home: Studio | $5,114 |
| Nursing Home: One Bedroom | $5,063 |
| Nursing Home: Two Bedroom | N/A |
| Nursing Home: Detached Cottage | N/A |
Average Cost of Assisted Living in Kerrville
The following is the average monthly cost of assisted living in Kerrville based on 2024 data.
| City | Average Monthly Cost |
|---|---|
| Kerrville | $4,589 |
| Shavano Park | $4,123 |
| Johnson City | $3,782 |
Here is how the average cost of assisted living in Kerrville compares to Texas and the national average:
| Area | Average Monthly Cost |
|---|---|
| Kerrville | $4,589 |
| Texas | $4,628 |
| United States | $4,546 |
Senior Living Availability in Kerrville
Number of senior living facilities in:
5
Kerrville
5
Surrounding Area
1507
Texas
Kerrville Senior Demographics
Based on information from 2023, here are some details around the population of Kerrville, such as age distribution for seniors, and racial diversity.
Population
Kerrville has a population of 24,333.- 47.1% Male
- 52.9% Female
Marital Status
- 47.2% Married
- 14.2% Divorced
- 28.5% Never Married
- 10.1% Widowed
Age
Seniors make up about 41.5% of the population.- 9.3% in their 50s
- 12.4% in their 60s
- 10.8% in their 70s
- 9% in their 80s
Diversity
- 76.2% White
- 2.3% Black
- 0.8% Asian
- 0.2% Native
- 0% Pacific
- 9.7% Identifying as Other
- 10.8% Mixed Race
- 30.8% Hispanic
