Best Assisted Living Facilities in Athens, TX
Find local assisted living and retirement communities in the Athens, TX area.
3 Communities were found near Athens, TX
City
Care Type
- Adult Day Services
- Assisted Living
- Home Care
- Independent Living
- Memory Care
- Nursing Home
- Residential Care Home
- Senior Apartments
- Distance from City Center
- Highest Rating
- Name: A - Z
- Name: Z - A

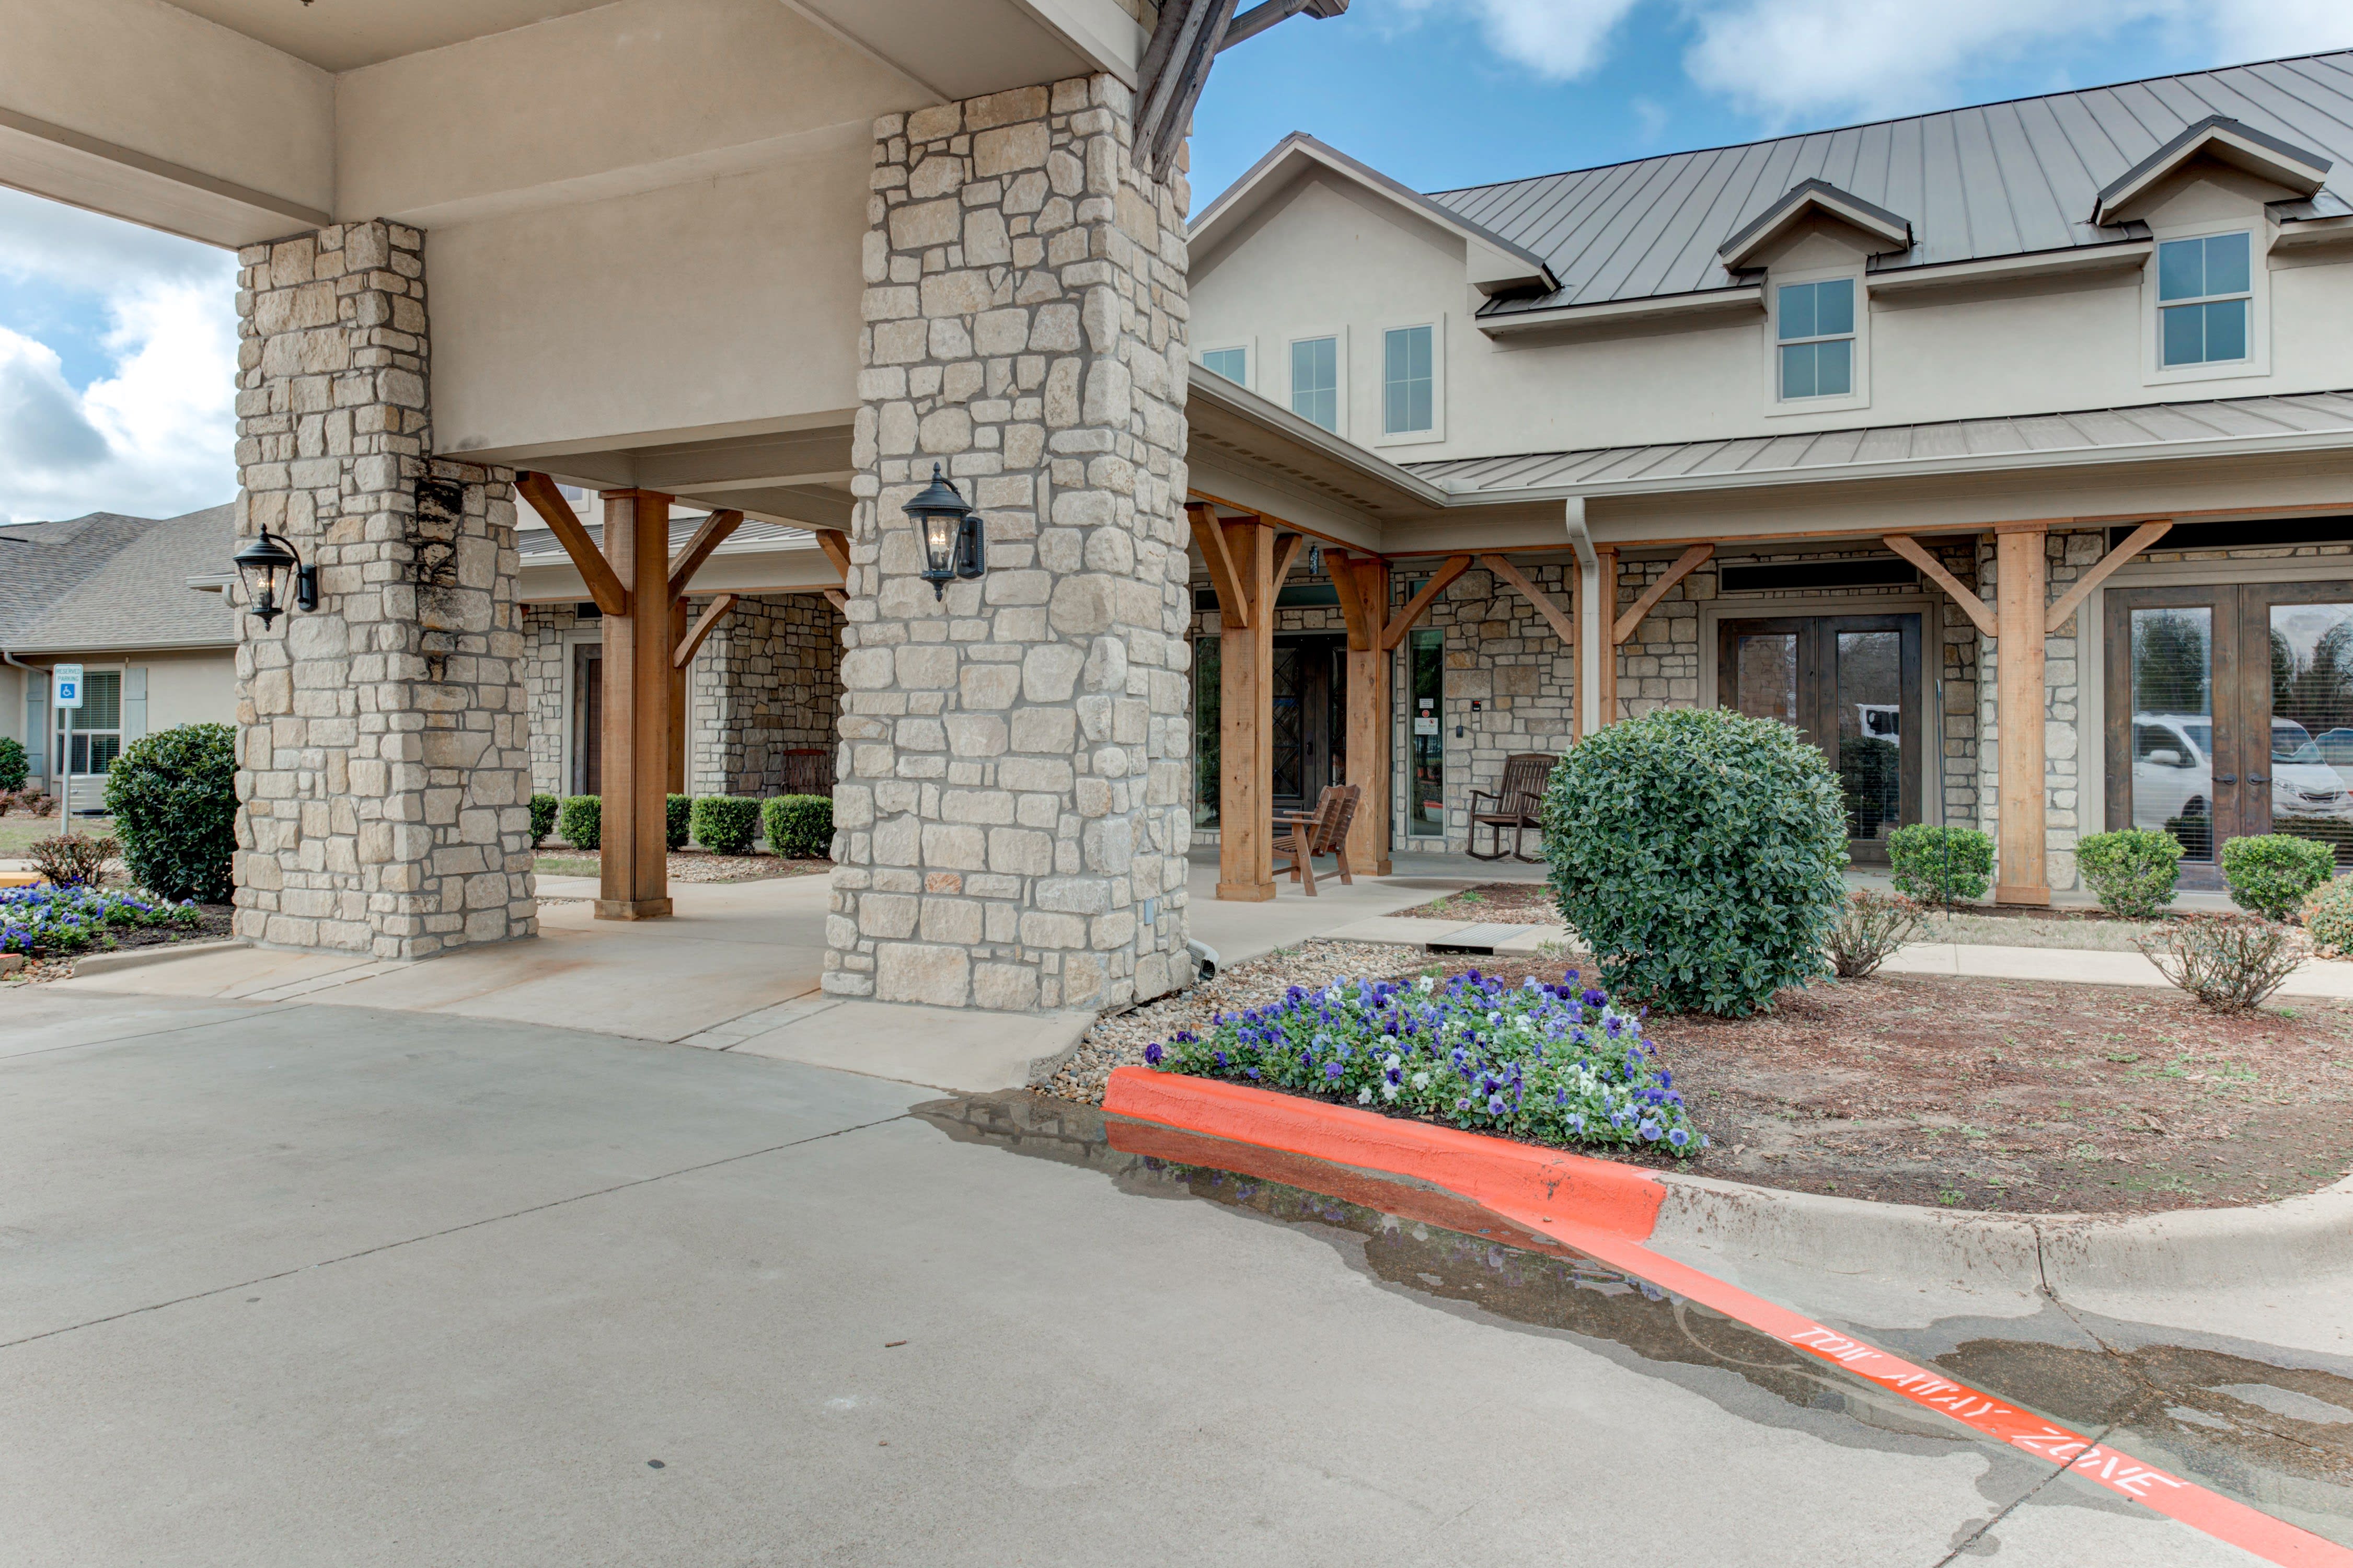
Lakeland House
213 W Cayuga Dr, Athens, TX 75751 (2 mi from city center)
Assisted Living

Arabella of Athens Senior Living
413 Gibson Rd, Athens, TX 75751 (2.9 mi from city center)
Assisted Living
Map of Assisted Living in Athens
Find the right senior living community by location- Country Place Senior Living of Athens
- Lakeland House
- Arabella of Athens Senior Living
Senior Living Statistics for Athens, Texas
Average Senior Living Costs by Housing Type
The cost of senior housing in Athens varies depending on the type of accommodation and level of care. The following is the average monthly cost of senior housing based on data from 2023-2024.
| Housing Type | Average Monthly Cost |
|---|---|
| Assisted Living | $3,901 |
| Memory Care | $3,901 |
| Independent Living | $3,556 |
| Nursing Home: Private Room | $4,165 |
| Nursing Home: Semi-Private Room | $5,420 |
| Nursing Home: Studio | $4,123 |
| Nursing Home: One Bedroom | $4,965 |
| Nursing Home: Two Bedroom | $3,109 |
| Nursing Home: Detached Cottage | N/A |
Average Cost of Assisted Living in Athens
The following is the average monthly cost of assisted living in Athens based on 2024 data.
| City | Average Monthly Cost |
|---|---|
| Athens | $3,901 |
| Mabank | $3,457 |
| Seven Points | $3,323 |
Here is how the average cost of assisted living in Athens compares to Texas and the national average:
| Area | Average Monthly Cost |
|---|---|
| Athens | $3,901 |
| Texas | $4,628 |
| United States | $4,546 |
Senior Living Availability in Athens
Number of senior living facilities in:
3
Athens
4
Surrounding Area
1507
Texas
Athens Senior Demographics
Based on information from 2023, here are some details around the population of Athens, such as age distribution for seniors, and racial diversity.
Population
Athens has a population of 12,878.- 46.8% Male
- 53.2% Female
Marital Status
- 42.7% Married
- 13.9% Divorced
- 34.2% Never Married
- 9.2% Widowed
Age
Seniors make up about 38.5% of the population.- 12.4% in their 50s
- 9.9% in their 60s
- 9.4% in their 70s
- 6.8% in their 80s
Diversity
- 59.8% White
- 17% Black
- 2.6% Asian
- 0.2% Native
- 0.1% Pacific
- 3.2% Identifying as Other
- 17.2% Mixed Race
- 30.5% Hispanic

