Best Assisted Living Facilities in Orangeburg, SC
Find local assisted living and retirement communities in the Orangeburg, SC area.
3 Communities were found near Orangeburg, SC
City
Care Type
- Adult Day Services
- Assisted Living
- Home Care
- Independent Living
- Memory Care
- Nursing Home
- Residential Care Home
- Senior Apartments
- Distance from City Center
- Highest Rating
- Name: A - Z
- Name: Z - A

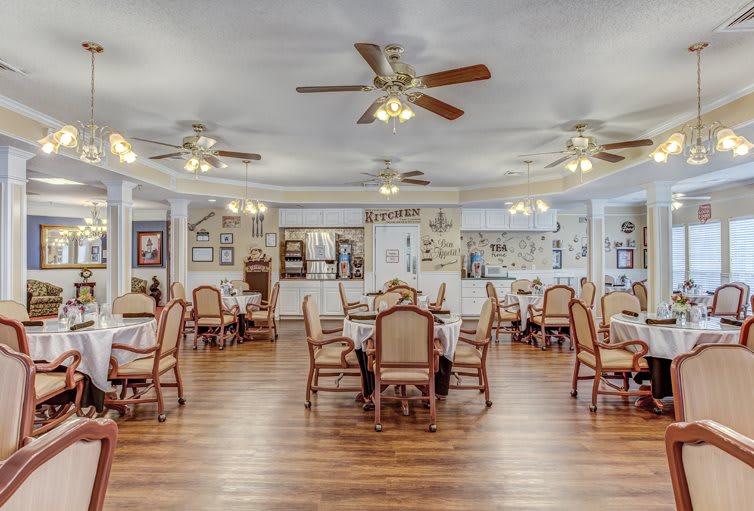
The Legacy of Orangeburg
2306 Riverbank Drive, Orangeburg, SC 29118 (2.1 mi from city center)
Assisted Living

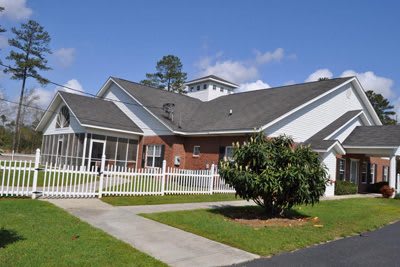
Longwood Plantation
1687 Longwood Dr, Orangeburg, SC 29118 (2.4 mi from city center)
Assisted Living

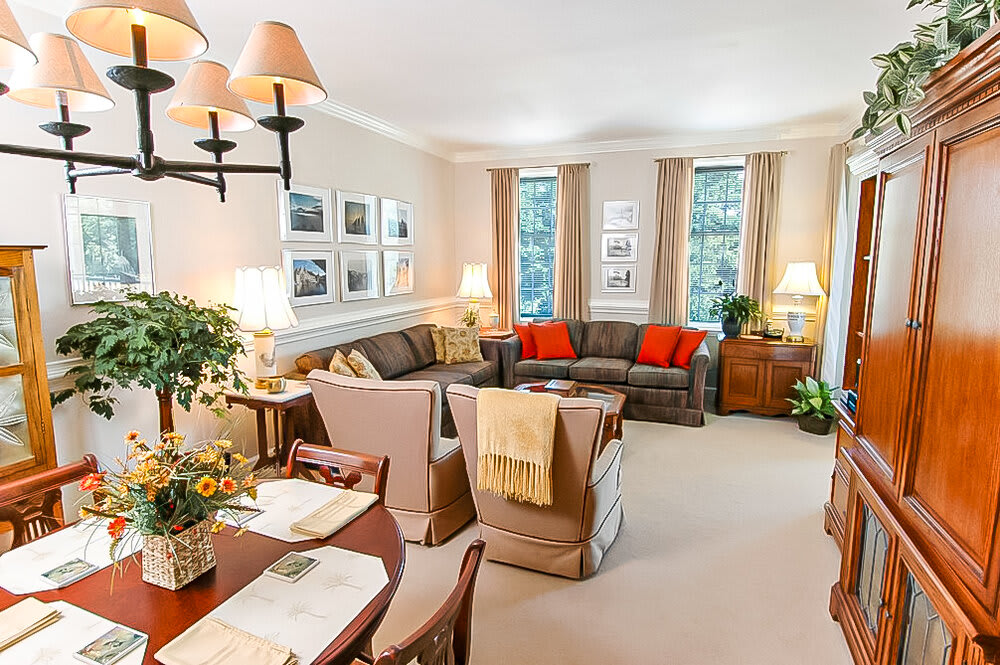
The Oaks on the Edisto
1000 Methodist Oaks Dr, Orangeburg, SC 29115 (4.7 mi from city center)
Assisted Living
Map of Assisted Living in Orangeburg
Find the right senior living community by location- The Legacy of Orangeburg
- Longwood Plantation
- The Oaks on the Edisto
Senior Living Statistics for Orangeburg, South Carolina
Average Senior Living Costs by Housing Type
The cost of senior housing in Orangeburg varies depending on the type of accommodation and level of care. The following is the average monthly cost of senior housing based on data from 2023-2024.
| Housing Type | Average Monthly Cost |
|---|---|
| Assisted Living | $4,025 |
| Memory Care | $4,025 |
| Independent Living | $4,025 |
| Nursing Home: Private Room | $4,893 |
| Nursing Home: Semi-Private Room | $4,625 |
| Nursing Home: Studio | $3,715 |
| Nursing Home: One Bedroom | $4,480 |
| Nursing Home: Two Bedroom | N/A |
| Nursing Home: Detached Cottage | N/A |
Average Cost of Assisted Living in Orangeburg
The following is the average monthly cost of assisted living in Orangeburg based on 2024 data.
| City | Average Monthly Cost |
|---|---|
| Orangeburg | $4,025 |
| Vance | $2,928 |
| Govan | $3,106 |
Here is how the average cost of assisted living in Orangeburg compares to South Carolina and the national average:
| Area | Average Monthly Cost |
|---|---|
| Orangeburg | $4,025 |
| South Carolina | $4,087 |
| United States | $4,546 |
Senior Living Availability in Orangeburg
Number of senior living facilities in:
3
Orangeburg
3
Surrounding Area
274
South Carolina
Orangeburg Senior Demographics
Based on information from 2023, here are some details around the population of Orangeburg, such as age distribution for seniors, and racial diversity.
Population
Orangeburg has a population of 13,220.- 48.3% Male
- 51.7% Female
Marital Status
- 25.5% Married
- 11.8% Divorced
- 55.9% Never Married
- 6.8% Widowed
Age
Seniors make up about 35.5% of the population.- 10.4% in their 50s
- 13.7% in their 60s
- 6.7% in their 70s
- 4.7% in their 80s
Diversity
- 23.3% White
- 73.1% Black
- 1.2% Asian
- 0% Native
- 0.9% Pacific
- 0.1% Identifying as Other
- 1.4% Mixed Race
- 0.2% Hispanic
