Best Assisted Living Facilities in Stillwater, OK
Find local assisted living and retirement communities in the Stillwater, OK area.
3 Communities were found near Stillwater, OK
City
Care Type
- Adult Day Services
- Assisted Living
- Home Care
- Independent Living
- Memory Care
- Nursing Home
- Residential Care Home
- Senior Apartments
- Distance from City Center
- Highest Rating
- Name: A - Z
- Name: Z - A

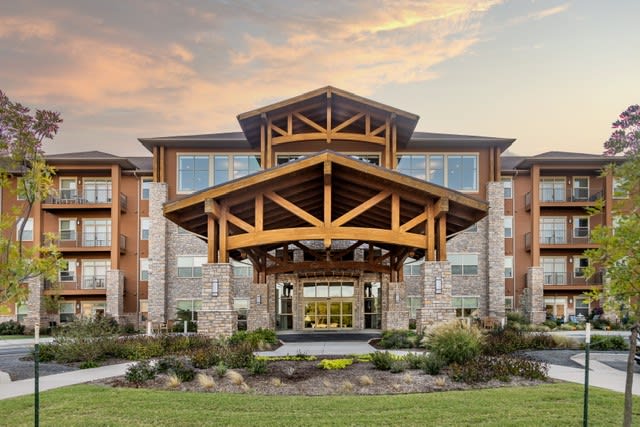
The Renaissance of Stillwater
1400 East McElroy Road, Stillwater, OK 74075 (1.8 mi from city center)
Assisted Living

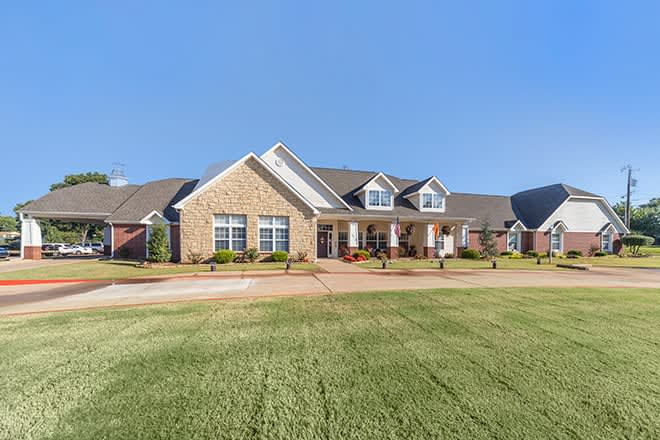
Brookdale Stillwater
1616 East McElroy Road, Stillwater, OK 74075 (2 mi from city center)
Assisted Living

Legacy Village of Stillwater
5601 N Washington St, Stillwater, OK 74075 (3.4 mi from city center)
Assisted Living
Map of Assisted Living in Stillwater
Find the right senior living community by location- The Renaissance of Stillwater
- Brookdale Stillwater
- Legacy Village of Stillwater
Senior Living Statistics for Stillwater, Oklahoma
Average Senior Living Costs by Housing Type
The cost of senior housing in Stillwater varies depending on the type of accommodation and level of care. The following is the average monthly cost of senior housing based on data from 2023-2024.
| Housing Type | Average Monthly Cost |
|---|---|
| Assisted Living | $3,478 |
| Memory Care | $3,478 |
| Independent Living | $3,478 |
| Nursing Home: Private Room | $3,586 |
| Nursing Home: Semi-Private Room | $4,041 |
| Nursing Home: Studio | $5,213 |
| Nursing Home: One Bedroom | N/A |
| Nursing Home: Two Bedroom | N/A |
| Nursing Home: Detached Cottage | N/A |
Average Cost of Assisted Living in Stillwater
The following is the average monthly cost of assisted living in Stillwater based on 2024 data.
| City | Average Monthly Cost |
|---|---|
| Stillwater | $3,478 |
| Perkins | $3,478 |
| Carney | $3,148 |
Here is how the average cost of assisted living in Stillwater compares to Oklahoma and the national average:
| Area | Average Monthly Cost |
|---|---|
| Stillwater | $3,478 |
| Oklahoma | $4,364 |
| United States | $4,546 |
Senior Living Availability in Stillwater
Number of senior living facilities in:
3
Stillwater
4
Surrounding Area
159
Oklahoma
Stillwater Senior Demographics
Based on information from 2023, here are some details around the population of Stillwater, such as age distribution for seniors, and racial diversity.
Population
Stillwater has a population of 48,644.- 51% Male
- 49% Female
Marital Status
- 28.8% Married
- 6.8% Divorced
- 60.3% Never Married
- 4.2% Widowed
Age
Seniors make up about 19% of the population.- 6% in their 50s
- 6% in their 60s
- 4.9% in their 70s
- 2.1% in their 80s
Diversity
- 75.7% White
- 4.7% Black
- 6.1% Asian
- 3.4% Native
- 0.1% Pacific
- 1% Identifying as Other
- 9.1% Mixed Race
- 5% Hispanic
