Best Assisted Living Facilities in Mandan, ND
Find local assisted living and retirement communities in the Mandan, ND area.
- Bismarck, ND
- ,
- Adult Day Services
- Assisted Living
- Home Care
- Independent Living
- Memory Care
- Nursing Home
- Residential Care Home
- Respite Care
- Senior Apartments
- Distance from City Center
- Highest Rating
- Name: A - Z
- Name: Z - A
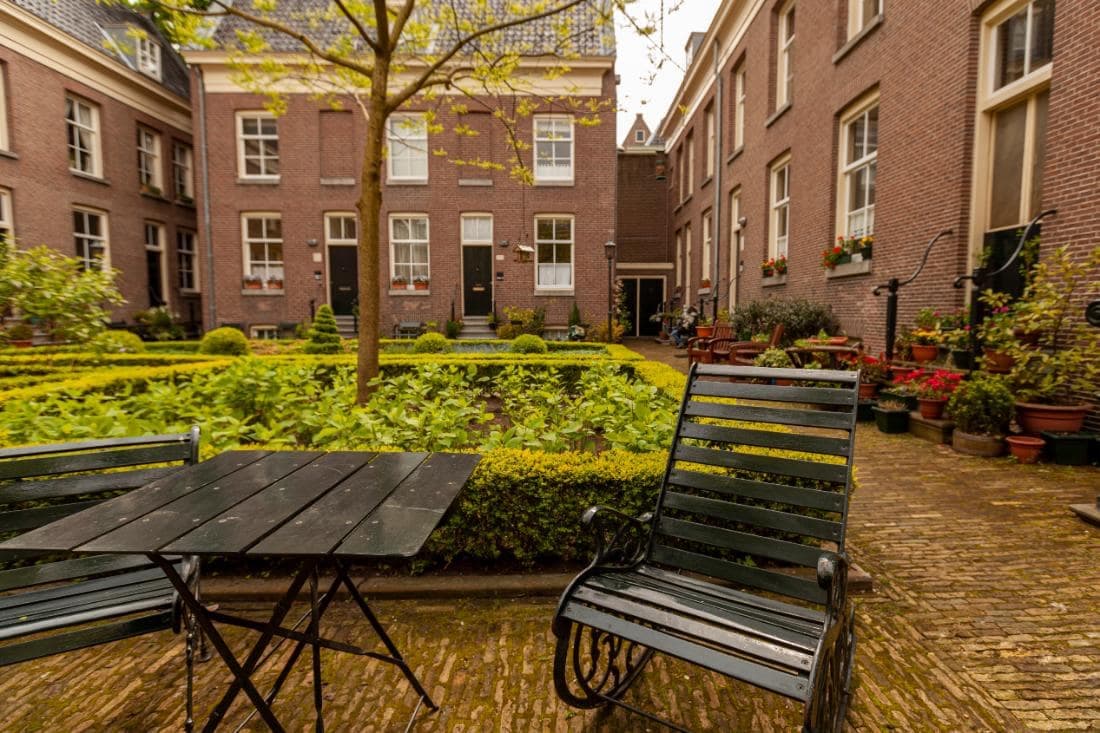
Lakewood Landing, Inc.
4401 21st St SE, Mandan, ND 58554 (0.2 mi from city center)Lakewood Landing offers exceptional senior care to seniors and their families in and around Mandan, North Dakota.

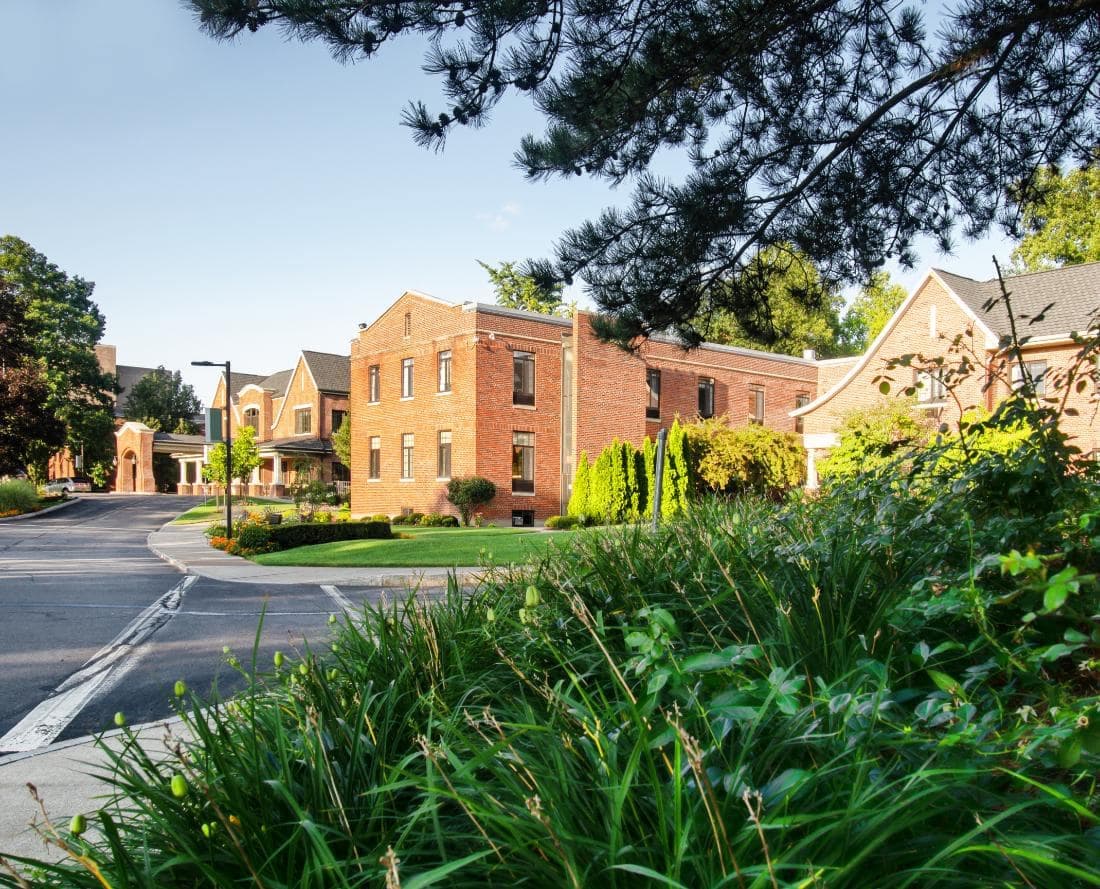
Edgewood Mandan, LLC
2801 39th Ave SE, Mandan, ND 58554 (3 mi from city center)Edgewood Mandan provides assisted living and memory care services in a quiet, small-town neighborhood setting.

Hay Creek Lodge Senior Living
1144 College Dr, Bismarck, ND 58501 (3.7 mi from city center)Hay Creek Lodge Senior Living offers independent living and assisted living services in a residential community along the Missouri River and adjacent to George Bird Rotary Arboretum.
Touchmark on West Century
1000 W Century Ave, Bismarck, ND 58503 (3.7 mi from city center)Touchmark on West Century provides a continuum of senior living services including independent living, assisted living, respite care, and memory care in Bismarck, ND.

Maple View Memory Care
4217 Montreal St, Bismarck, ND 58503 (4.8 mi from city center)Maple View Memory Care is a senior living facility specializing in memory care for individuals with Alzheimer's disease and dementia.

Edgewood Vista
3406 Dominion St, Bismarck, ND 58503 (5.2 mi from city center)Edgewood Vista offers a variety of care types including Assisted Living, Independent Living, Hospice Care, Memory Care, and Short-term Rehabilitation Care.
The Terrace
901 E Bowen Ave, Bismarck, ND 58504 (5.5 mi from city center)The Terrace is a 40-bed basic care facility offering assisted living services in a pleasant residential setting.

Overlook Ridge Senior Apartments
2200 Koch Dr, Bismarck, ND 58503 (6.3 mi from city center)Overlook Ridge is a 55+ community that offers carefree, maintenance-free living for active older adults.

Edgewood Bismarck Village
3124 Colorado Ln, Bismarck, ND 58503 (6.4 mi from city center)Edgewood Bismarck Village offers a variety of care types including Assisted Living, Independent Living, Hospice Care, Memory Care, and Short-term Rehabilitation Care.

Marillac Manor Inc
1016 N 28th St, Bismarck, ND 58501 (6.6 mi from city center)Marillac Manor offers senior living and inpatient and outpatient rehabilitation services in Bismarck, North Dakota.
Map of Assisted Living in Mandan
Find the right senior living community by location- Lakewood Landing, Inc.
- Edgewood Mandan, LLC
- Hay Creek Lodge Senior Living
- Touchmark on West Century
- Maple View Memory Care
- Edgewood Vista
- The Terrace
- Overlook Ridge Senior Apartments
- Edgewood Bismarck Village
- Marillac Manor Inc
Senior Living Statistics for Mandan, North Dakota
Average Senior Living Costs by Housing Type
| Housing Type | Average Monthly Cost |
|---|---|
| Assisted Living | $3,870 |
| Memory Care | $3,870 |
| Independent Living | $3,630 |
| Nursing Home: Private Room | $5,610 |
| Nursing Home: Semi-Private Room | $4,530 |
| Nursing Home: Studio | $4,013 |
| Nursing Home: One Bedroom | $4,148 |
Average Cost of Assisted Living in Mandan
| City | Average Monthly Cost |
|---|---|
| Mandan | $3,870 |
| Bismarck | $3,870 |
| McClusky | $3,760 |
Here is how the average cost of assisted living in Mandan compares to North Dakota and the national average:
| Area | Average Monthly Cost |
|---|---|
| Mandan | $3,870 |
| North Dakota | $3,842 |
| United States | $4,546 |
Senior Living Availability in Mandan
Mandan
Surrounding Area
North Dakota
Mandan Senior Demographics
Population
Mandan has a population of 24,293.- 50.4% Male
- 49.6% Female
Marital Status
- 53.4% Married
- 10% Divorced
- 31.4% Never Married
- 5.2% Widowed
Age
Seniors make up about 32.8% of the population.- 11.2% in their 50s
- 12.8% in their 60s
- 5.8% in their 70s
- 3% in their 80s
Diversity
- 85.4% White
- 2.4% Black
- 0.3% Asian
- 4.4% Native
- 0.1% Pacific
- 3.3% Identifying as Other
- 4.1% Mixed Race
- 5.4% Hispanic
Additional Cities with Assisted Living Near Mandan
Senior Living Ratings Methodology
Our experts spent over 50 hours researching the best communities in each city, focusing on these key factors.

Available Care
We value communities that offer more than standard living services, such as memory care and independent living. We think this is beneficial for older adults, as it allows a community to meet your changing needs over time.
Amenities
Amenities can help an assisted living community feel like a luxury resort or a home away from home. Our research focuses on communities that offer extra perks and benefits for seniors to enjoy.
Location
Location can be important. Since many seniors like to have certain comforts nearby, we look at communities close to parks, shopping areas, hospitals, museums, and other practical or entertaining points of interest.
Reviews
We read through dozens of reviews for every single contender and include a summary of our findings. In most cases, we see common themes regarding positive and negative feedback about each community. Just remember not to take individual reviews at face value.
Cost
Assisted living costs vary greatly based on the facility and level of care. We considered communities that are suitable for various budgets and offer solid value. All prices listed are from community websites.