Best Assisted Living Facilities in Catskill, NY
Find local assisted living and retirement communities in the Catskill, NY area.
3 Communities were found near Catskill, NY
City
Care Type
- Adult Day Services
- Assisted Living
- Home Care
- Independent Living
- Memory Care
- Nursing Home
- Residential Care Home
- Senior Apartments
- Distance from City Center
- Highest Rating
- Name: A - Z
- Name: Z - A

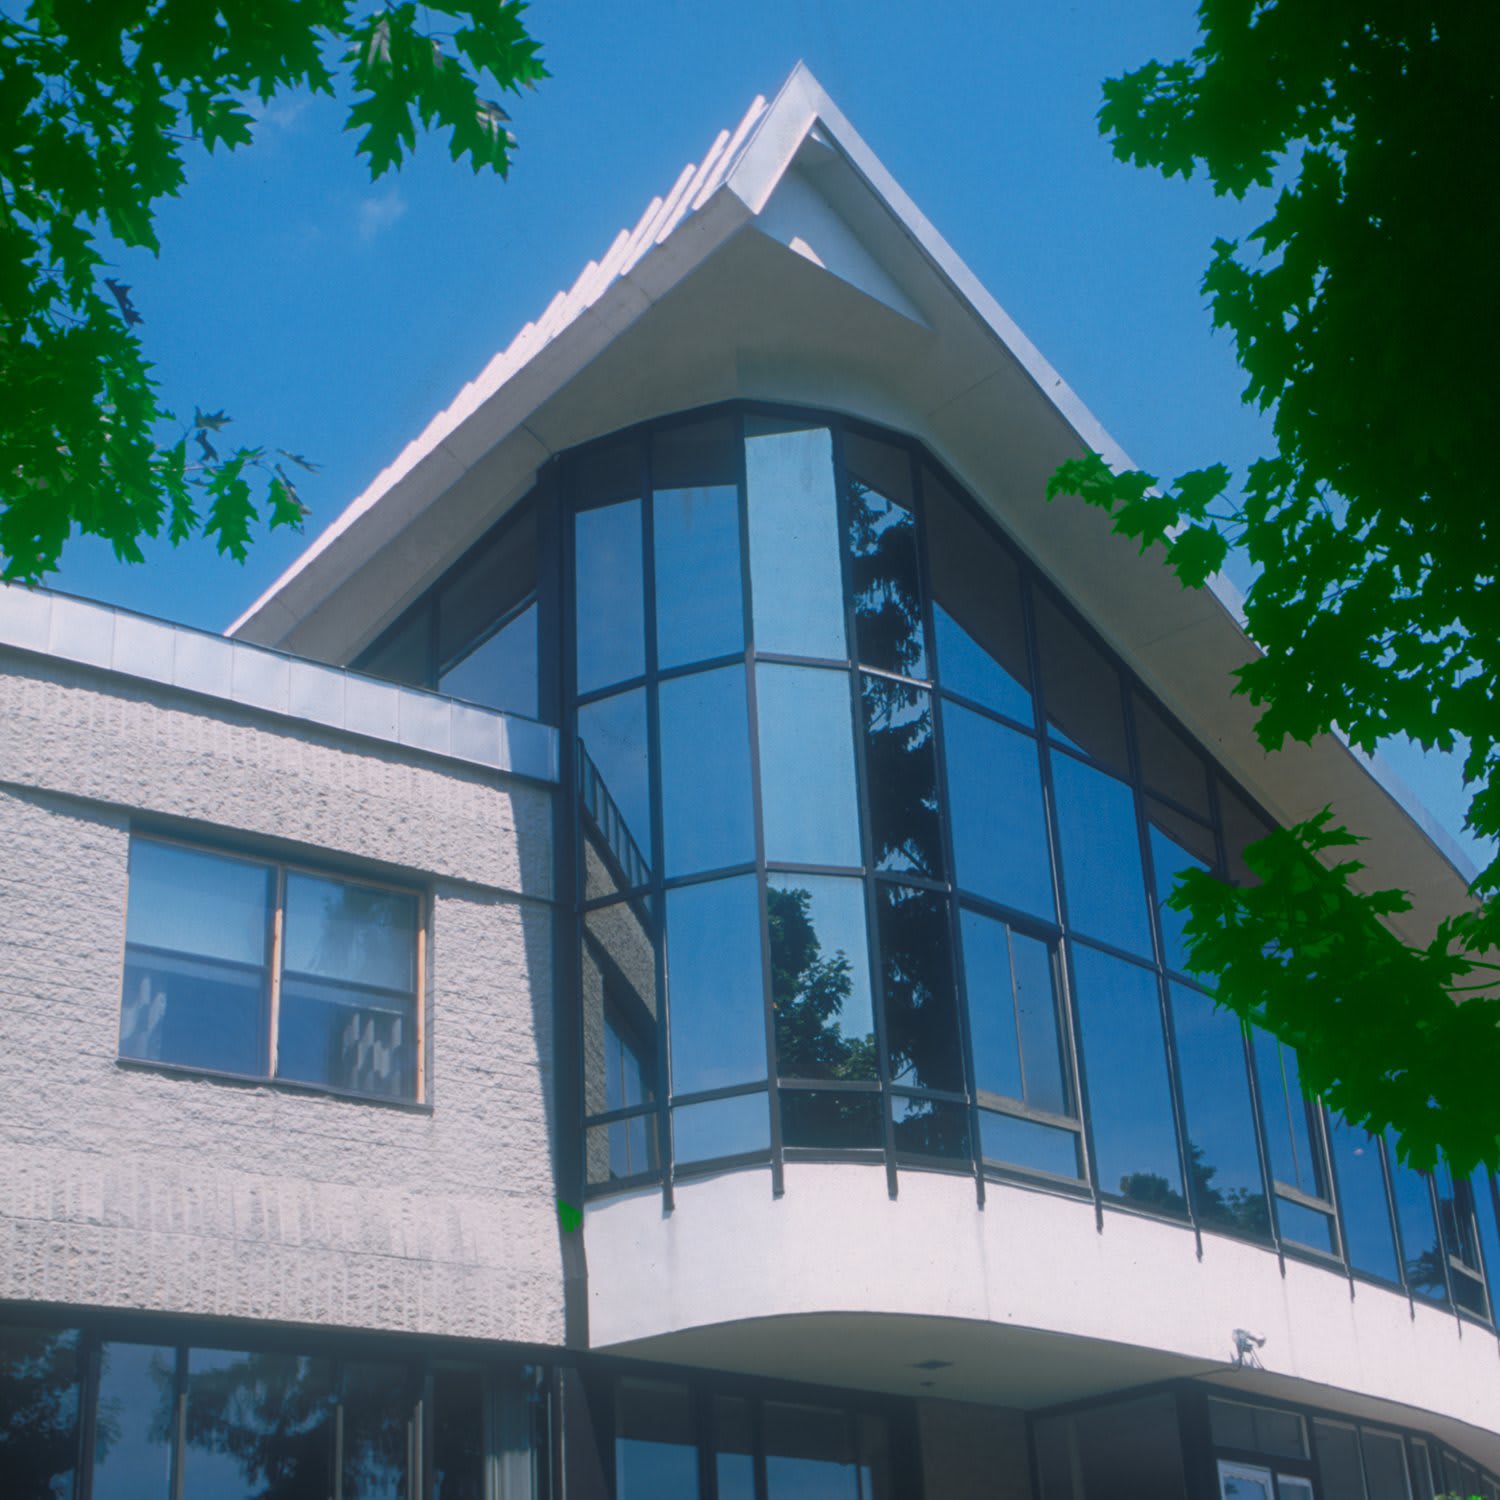
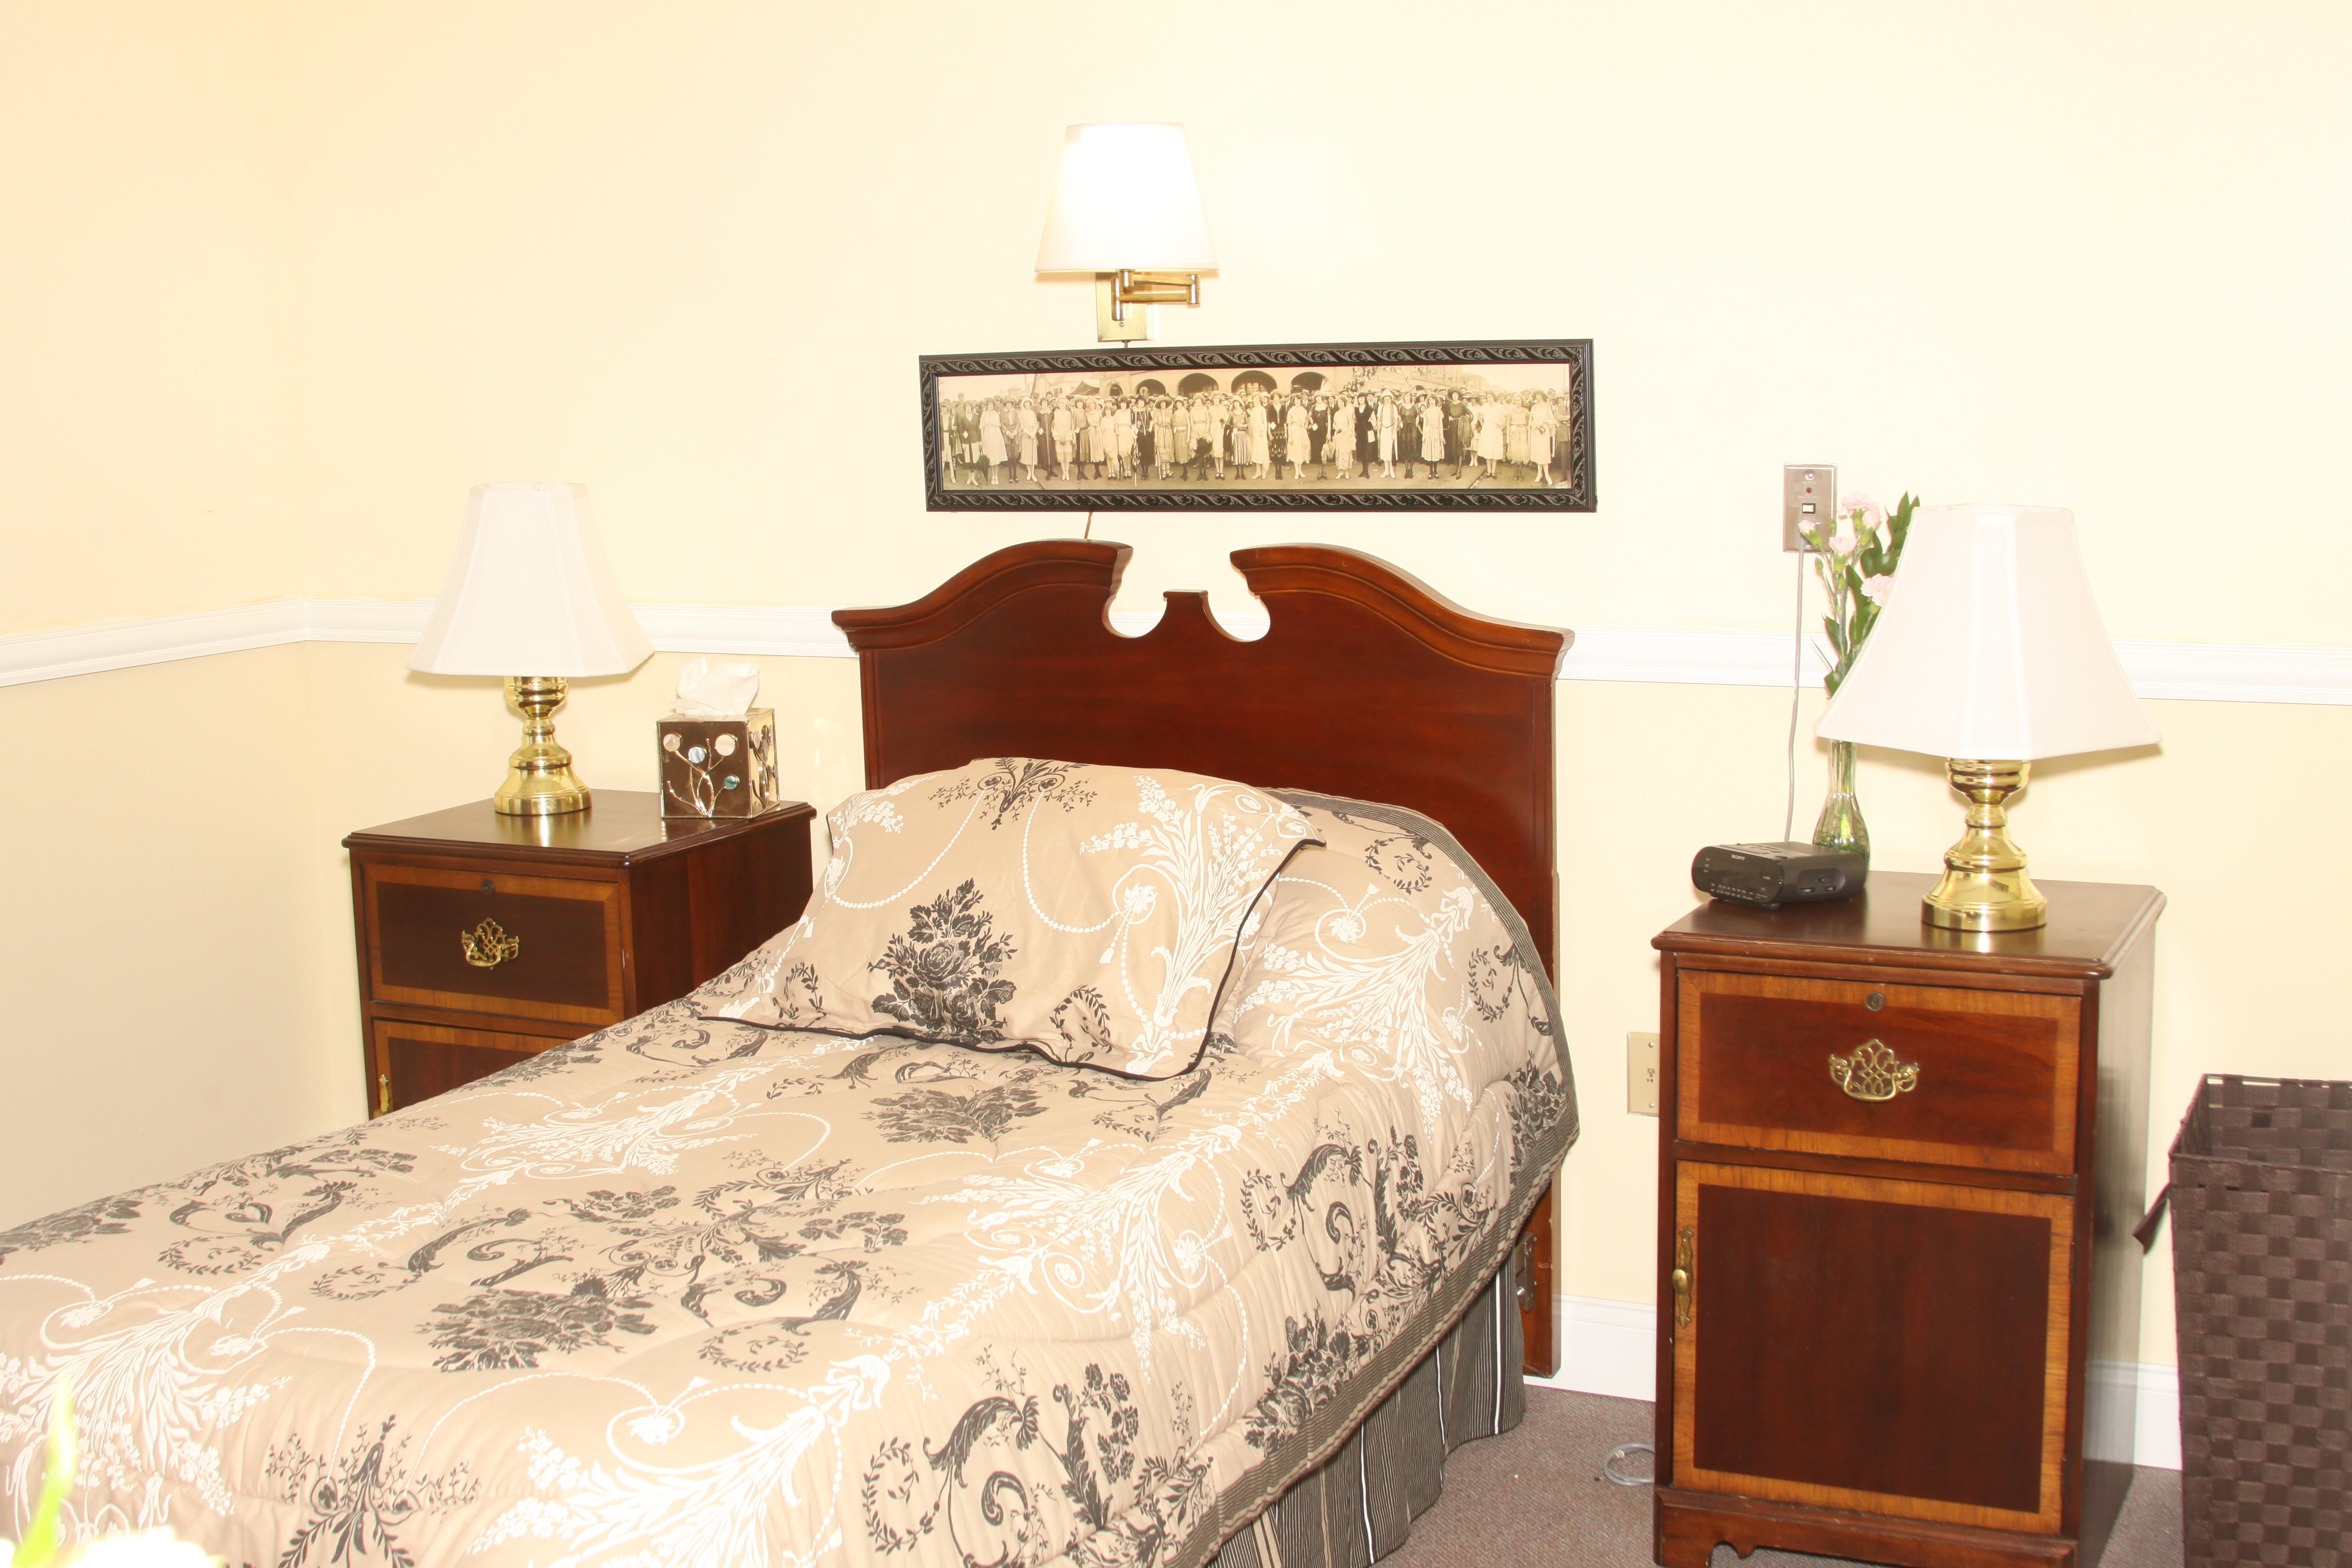
Home Sweet Home on the Hudson
38 Prospect Ave, Catskill, NY 12414 (4.5 mi from city center)
Assisted Living
Map of Assisted Living in Catskill
Find the right senior living community by location- Eddy Visiting Nurse Association (Columbia & Greene counties)
- The Eliot at Catskill
- Home Sweet Home on the Hudson
Senior Living Statistics for Catskill, New York
Average Senior Living Costs by Housing Type
The cost of senior housing in Catskill varies depending on the type of accommodation and level of care. The following is the average monthly cost of senior housing based on data from 2023-2024.
| Housing Type | Average Monthly Cost |
|---|---|
| Assisted Living | $4,892 |
| Memory Care | $4,958 |
| Independent Living | $4,298 |
| Nursing Home: Private Room | $6,000 |
| Nursing Home: Semi-Private Room | $5,401 |
| Nursing Home: Studio | $5,664 |
| Nursing Home: One Bedroom | $5,841 |
| Nursing Home: Two Bedroom | $6,775 |
| Nursing Home: Detached Cottage | $3,000 |
Average Cost of Assisted Living in Catskill
The following is the average monthly cost of assisted living in Catskill based on 2024 data.
| City | Average Monthly Cost |
|---|---|
| Catskill | $4,892 |
| Margaretville | $3,843 |
| Hobart | $3,382 |
Here is how the average cost of assisted living in Catskill compares to New York and the national average:
| Area | Average Monthly Cost |
|---|---|
| Catskill | $4,892 |
| New York | $5,545 |
| United States | $4,546 |
Senior Living Availability in Catskill
Number of senior living facilities in:
3
Catskill
0
Surrounding Area
544
New York
Catskill Senior Demographics
Based on information from 2023, here are some details around the population of Catskill, such as age distribution for seniors, and racial diversity.
Population
Catskill has a population of 11,351.- 49.1% Male
- 50.9% Female
Marital Status
- 38.2% Married
- 13% Divorced
- 39.5% Never Married
- 9.2% Widowed
Age
Seniors make up about 45.2% of the population.- 13.5% in their 50s
- 15.5% in their 60s
- 8.7% in their 70s
- 7.5% in their 80s
Diversity
- 82.6% White
- 7.9% Black
- 0.5% Asian
- 0.5% Native
- 0% Pacific
- 4.2% Identifying as Other
- 4.4% Mixed Race
- 8.8% Hispanic


