Best Assisted Living Facilities in Fremont, NE
Find local assisted living and retirement communities in the Fremont, NE area.
4 Communities were found near Fremont, NE
City
Care Type
- Adult Day Services
- Assisted Living
- Home Care
- Independent Living
- Memory Care
- Nursing Home
- Residential Care Home
- Senior Apartments
- Distance from City Center
- Highest Rating
- Name: A - Z
- Name: Z - A

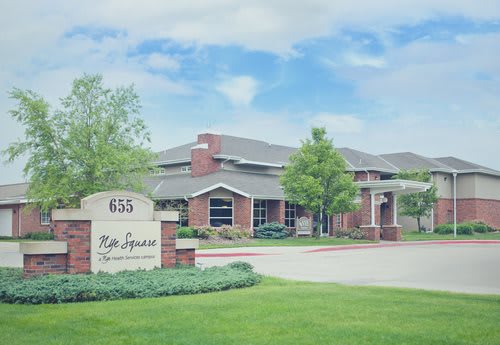
Nye Square
655 W 23rd St, Fremont, NE 68025 (1.2 mi from city center)
Assisted Living

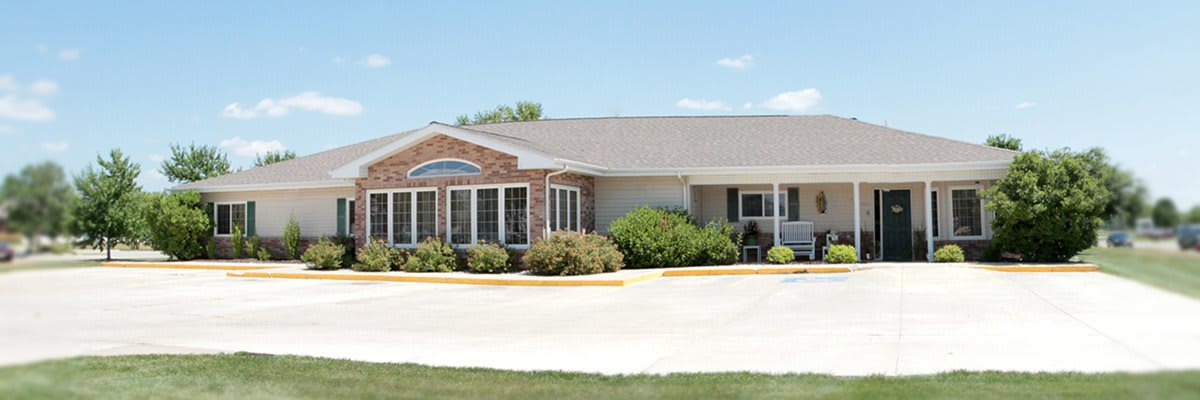
Edgewood Vista of Fremont
2910 N Clarkston Street, Fremont, NE 68025 (1.2 mi from city center)
Memory Care

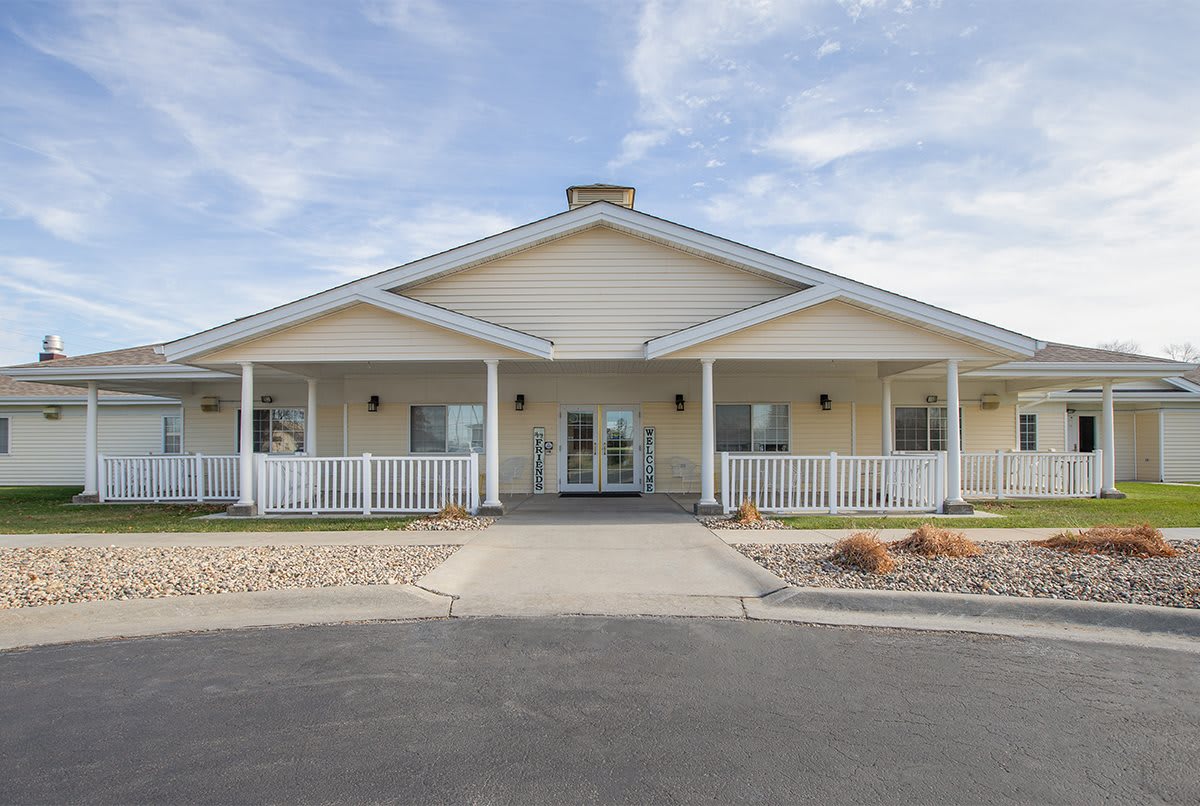
Pathfinder Senior Living
3010 N. Clarkson, Fremont, NE 68025 (1.3 mi from city center)
Assisted Living

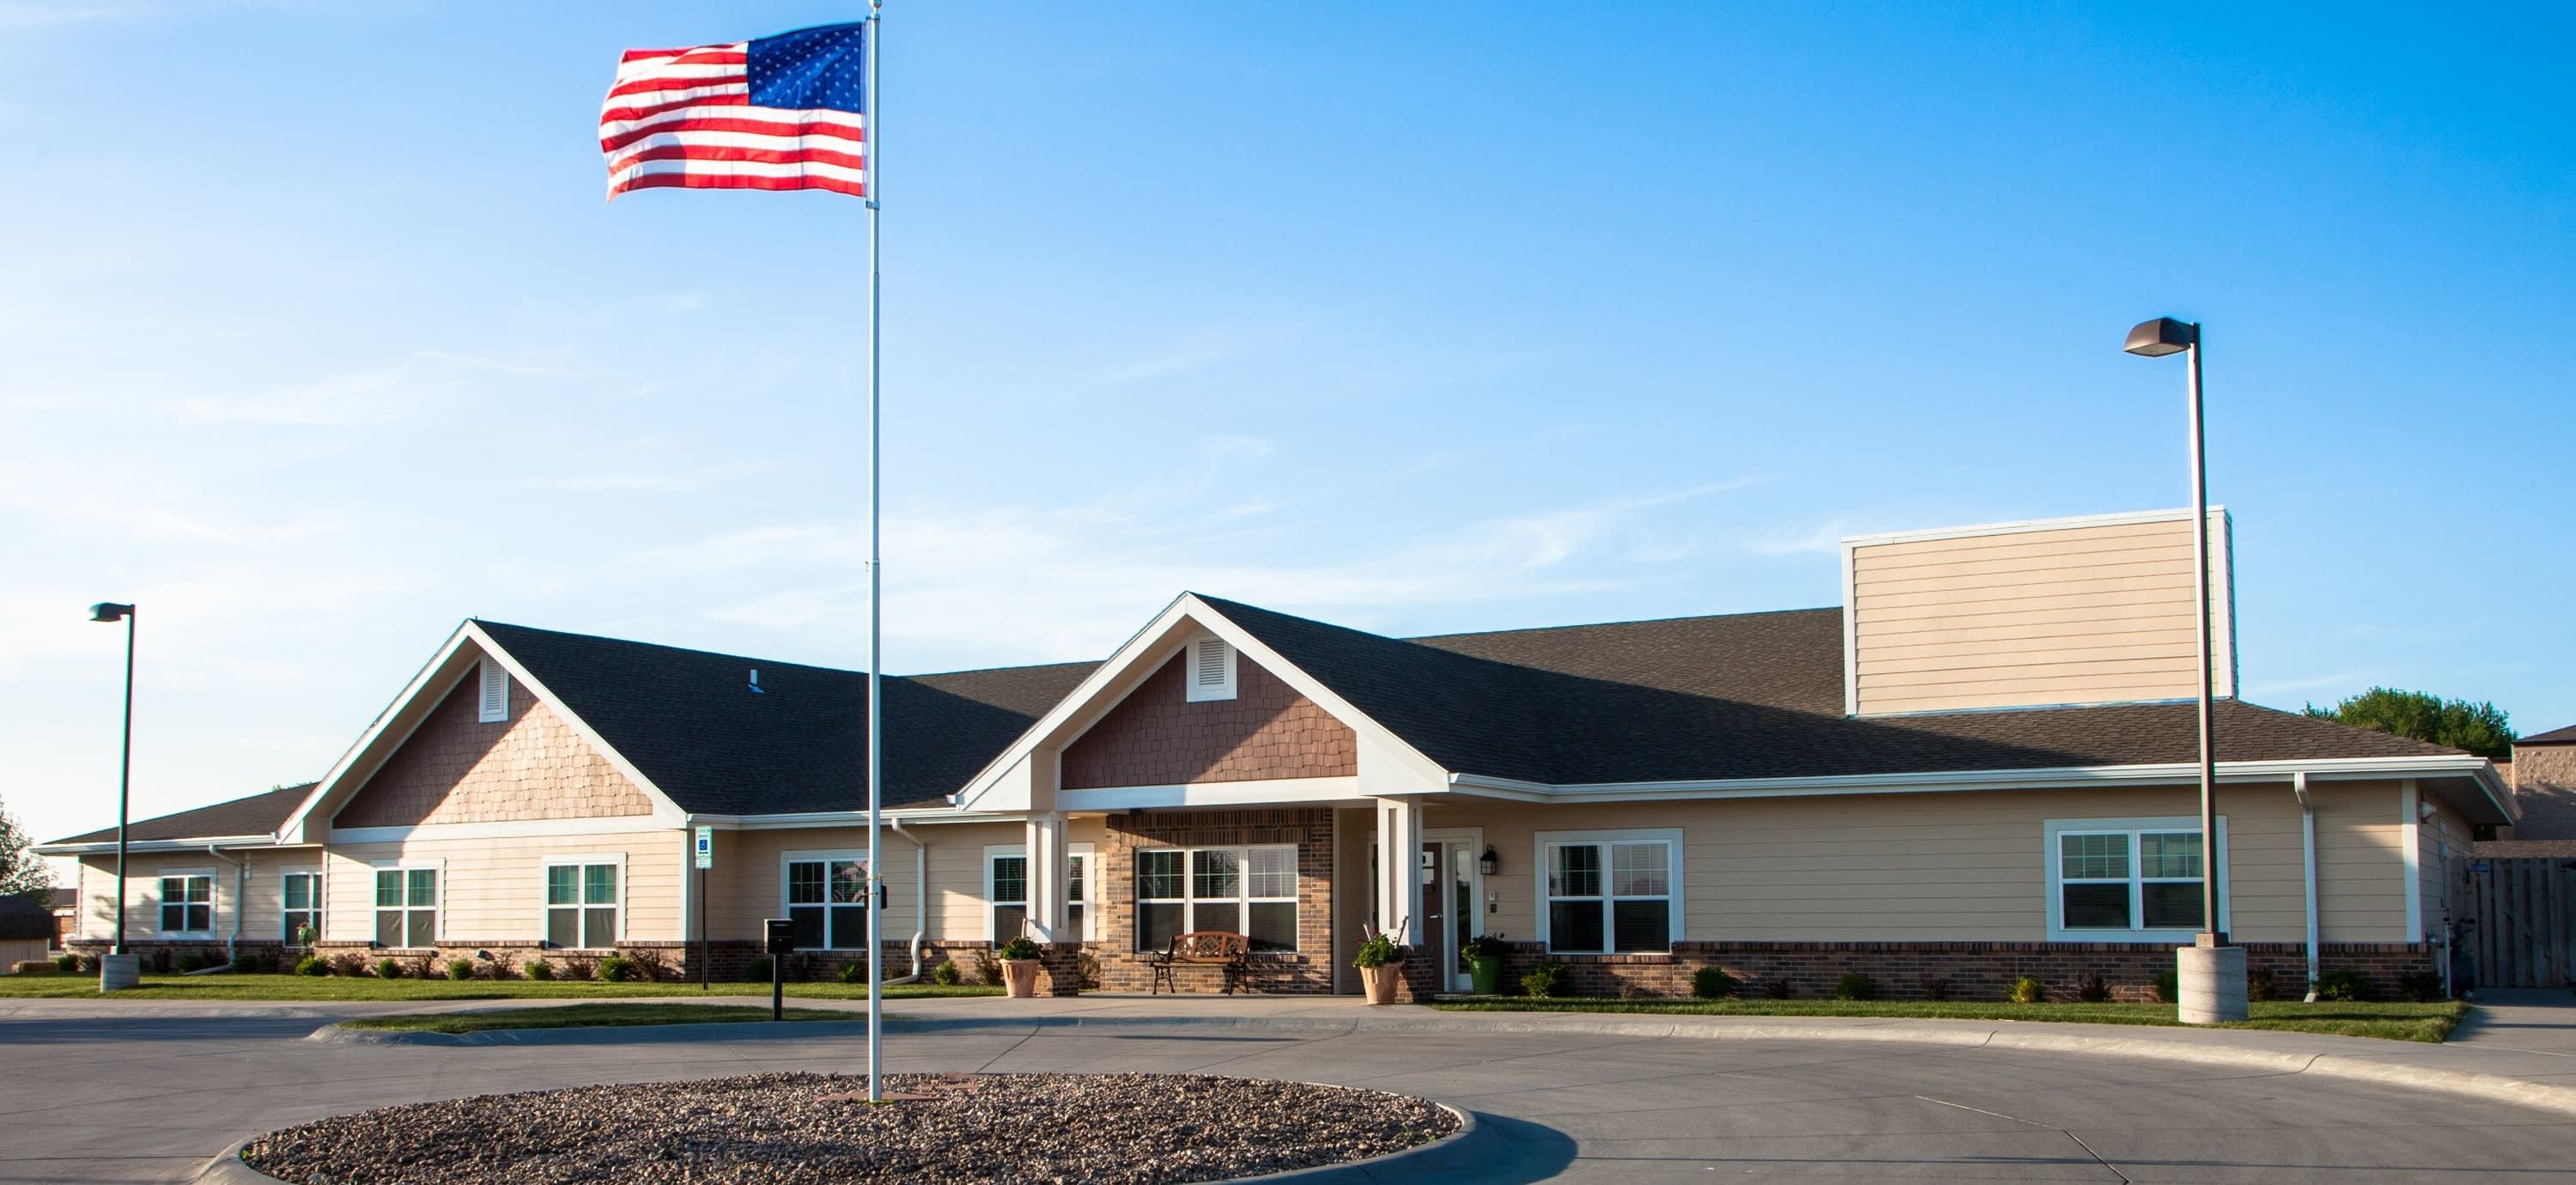
Providence Place Memory Care
749 E 32nd St, Fremont, NE 68025 (1.3 mi from city center)
Memory Care
Map of Assisted Living in Fremont
Find the right senior living community by location- Nye Square
- Edgewood Vista of Fremont
- Pathfinder Senior Living
- Providence Place Memory Care
Senior Living Statistics for Fremont, Nebraska
Average Senior Living Costs by Housing Type
The cost of senior housing in Fremont varies depending on the type of accommodation and level of care. The following is the average monthly cost of senior housing based on data from 2023-2024.
| Housing Type | Average Monthly Cost |
|---|---|
| Assisted Living | $4,622 |
| Memory Care | $4,376 |
| Independent Living | $3,160 |
| Nursing Home: Private Room | $4,288 |
| Nursing Home: Semi-Private Room | $4,918 |
| Nursing Home: Studio | N/A |
| Nursing Home: One Bedroom | N/A |
| Nursing Home: Two Bedroom | N/A |
| Nursing Home: Detached Cottage | N/A |
Average Cost of Assisted Living in Fremont
The following is the average monthly cost of assisted living in Fremont based on 2024 data.
| City | Average Monthly Cost |
|---|---|
| Fremont | $4,622 |
| Scribner | $3,963 |
| Uehling | $3,867 |
Here is how the average cost of assisted living in Fremont compares to Nebraska and the national average:
| Area | Average Monthly Cost |
|---|---|
| Fremont | $4,622 |
| Nebraska | $4,105 |
| United States | $4,546 |
Senior Living Availability in Fremont
Number of senior living facilities in:
4
Fremont
4
Surrounding Area
111
Nebraska
Fremont Senior Demographics
Based on information from 2023, here are some details around the population of Fremont, such as age distribution for seniors, and racial diversity.
Population
Fremont has a population of 27,230.- 49.7% Male
- 50.3% Female
Marital Status
- 48.3% Married
- 14% Divorced
- 30.5% Never Married
- 7.2% Widowed
Age
Seniors make up about 36.6% of the population.- 12% in their 50s
- 11.3% in their 60s
- 8.1% in their 70s
- 5.2% in their 80s
Diversity
- 88% White
- 0.7% Black
- 0.3% Asian
- 1.8% Native
- 0% Pacific
- 3.3% Identifying as Other
- 6% Mixed Race
- 16.2% Hispanic
