Best Assisted Living Facilities in Manhattan, KS
Find local assisted living and retirement communities in the Manhattan, KS area.
4 Communities were found near Manhattan, KS
City
Care Type
- Adult Day Services
- Assisted Living
- Home Care
- Independent Living
- Memory Care
- Nursing Home
- Residential Care Home
- Senior Apartments
- Distance from City Center
- Highest Rating
- Name: A - Z
- Name: Z - A

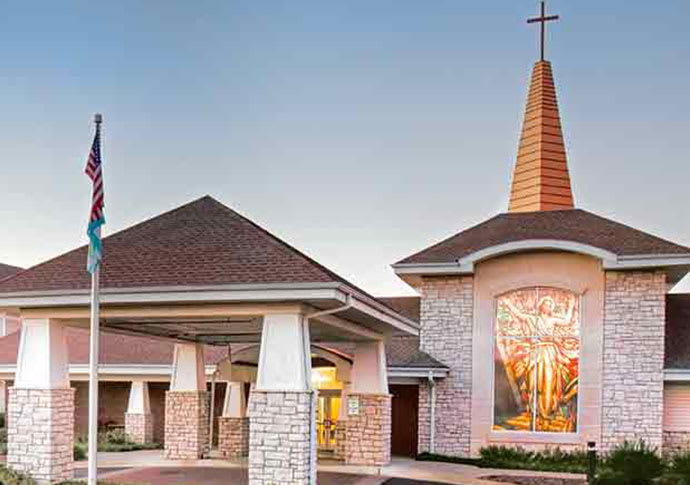
Ascension Living Via Christi Village - Manhattan
2800 Willow Grove Rd, Manhattan, KS 66502 (1.8 mi from city center)
Assisted Living

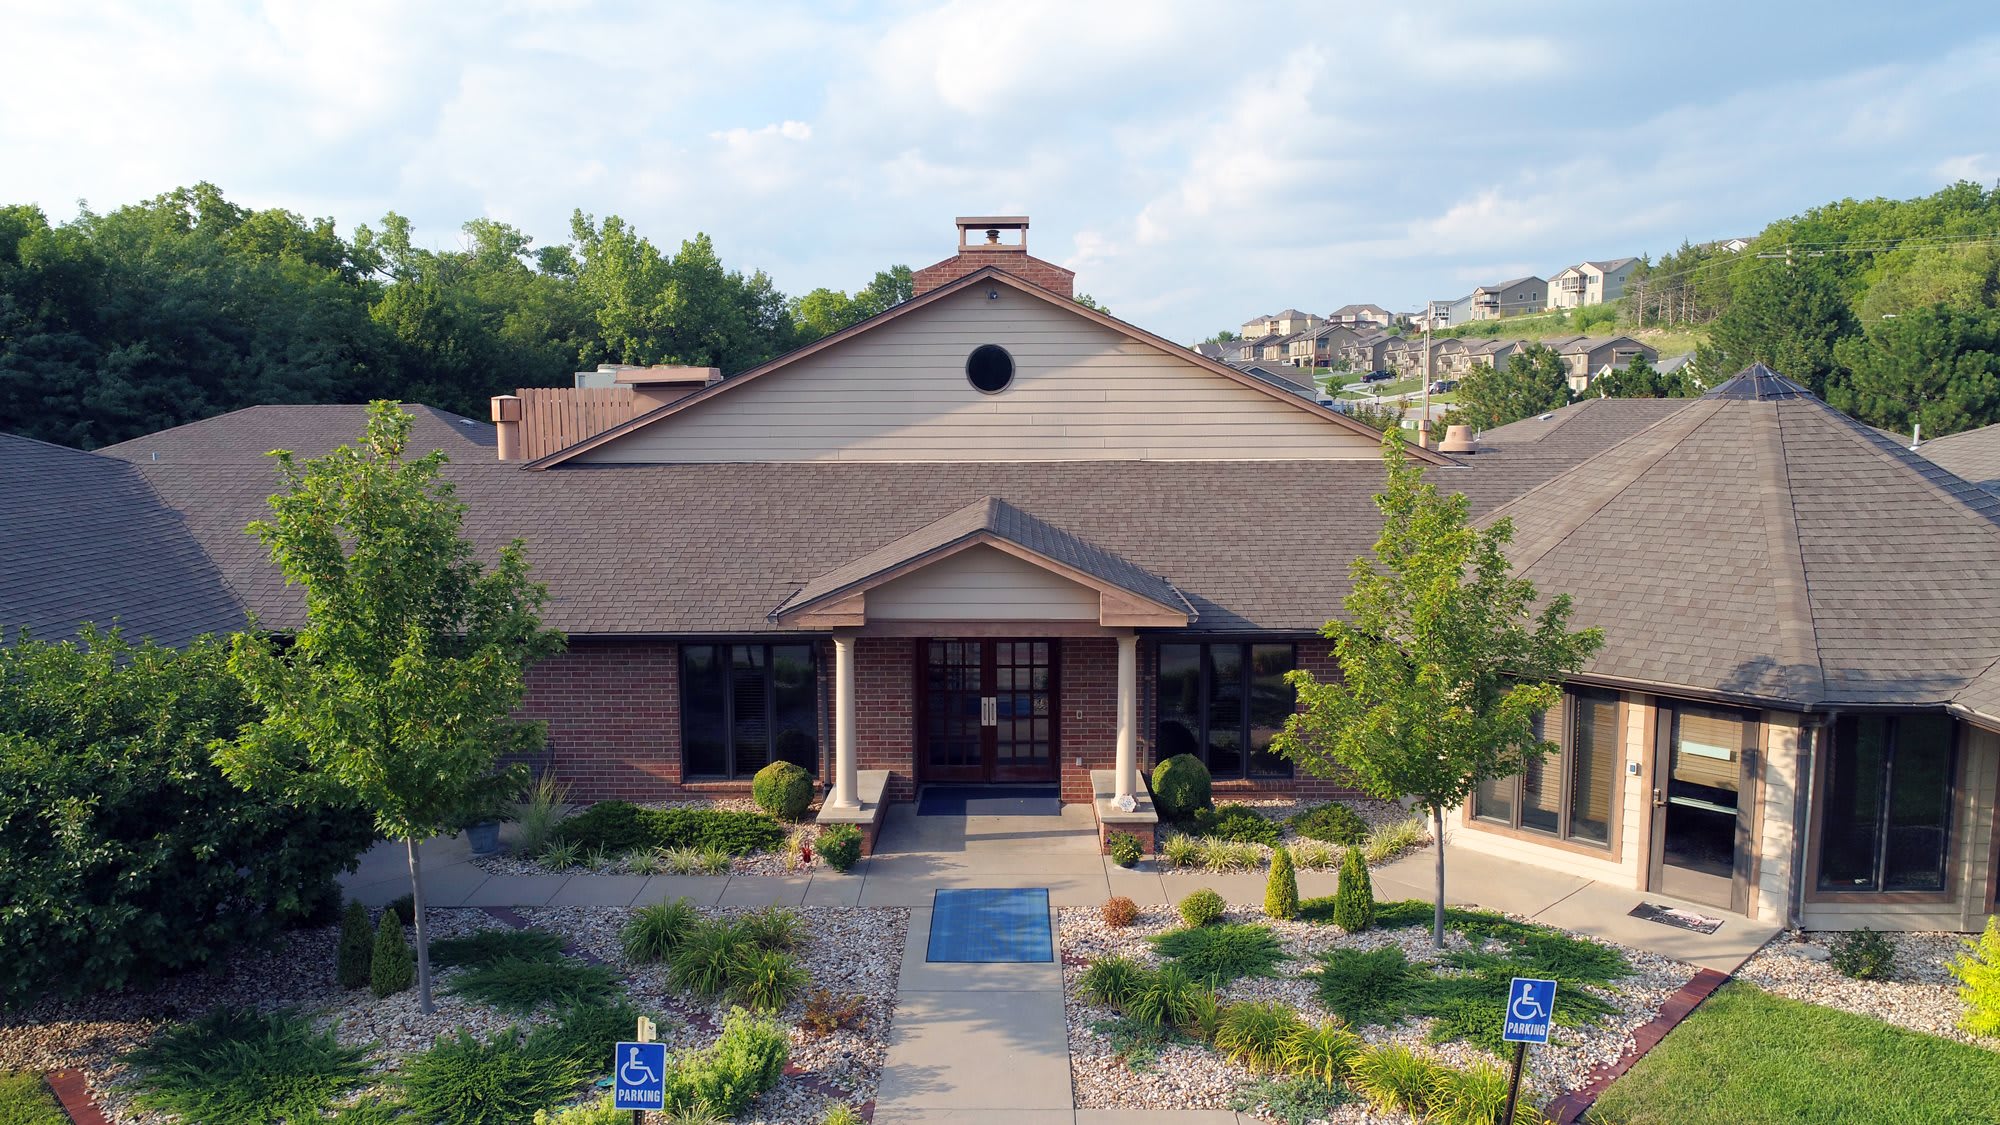
Stoneybrook Assisted Living
2029 Little Kitten Ave, Manhattan, KS 66503 (2 mi from city center)
Assisted Living

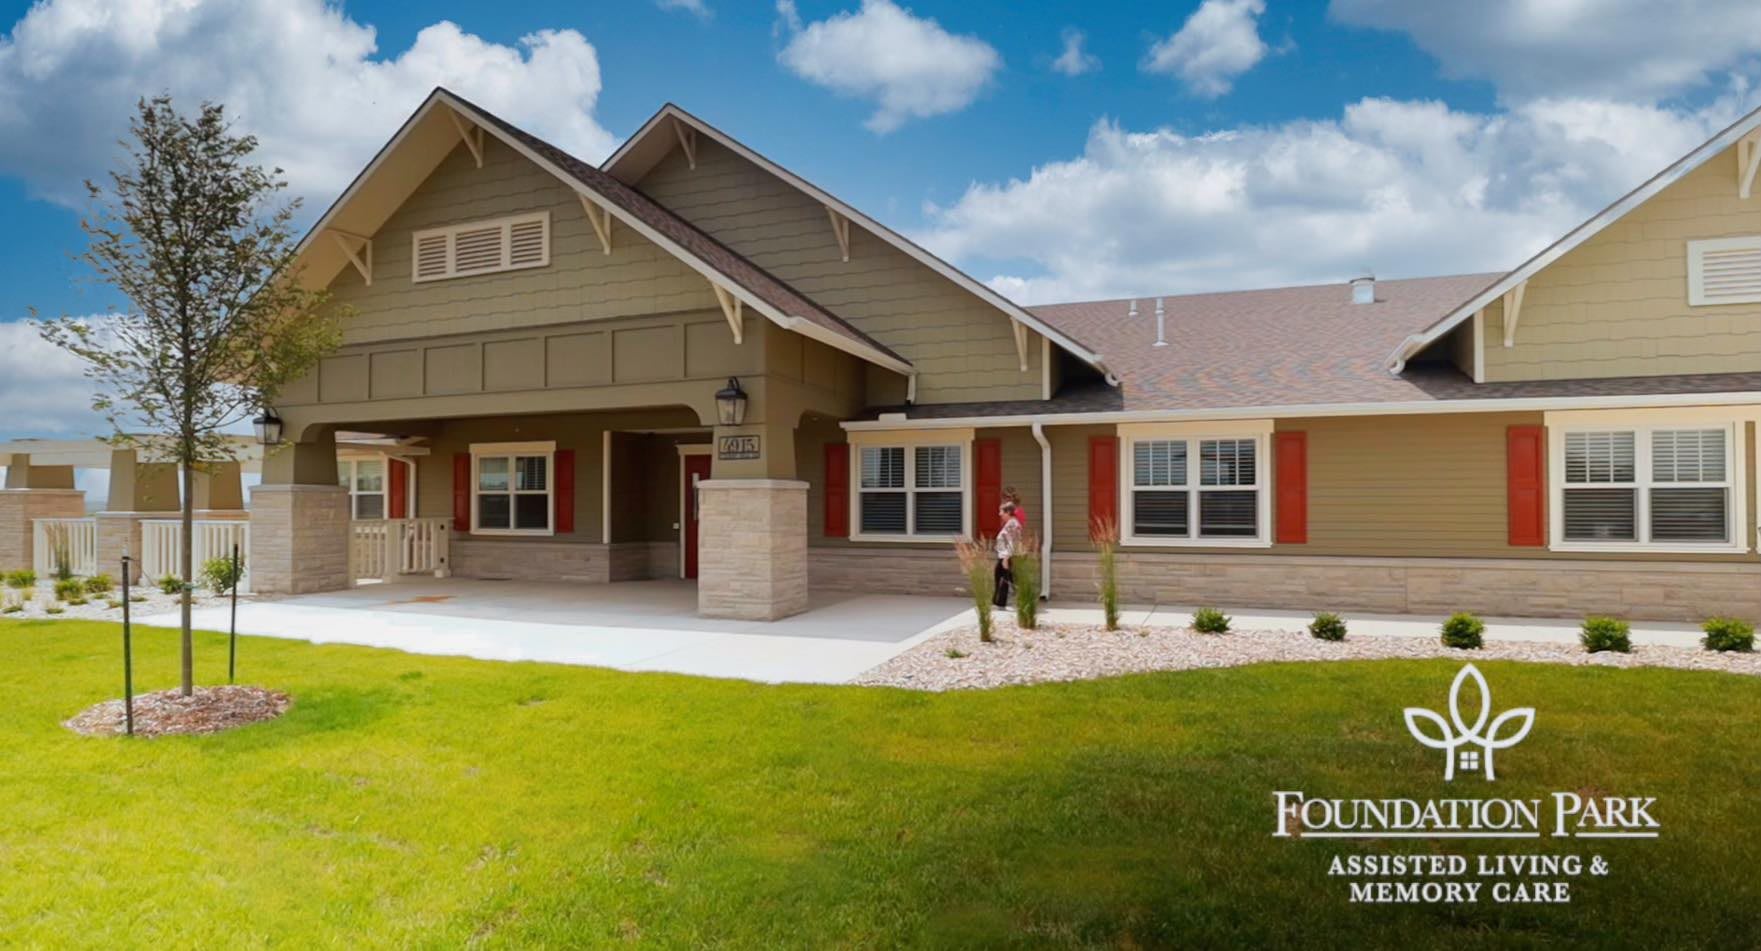
Foundation Park
4915 Colbert Hills Drive, Manhattan, KS 66503 (2.3 mi from city center)
Assisted Living
Map of Assisted Living in Manhattan
Find the right senior living community by location- Garden Grove Apartments
- Ascension Living Via Christi Village - Manhattan
- Stoneybrook Assisted Living
- Foundation Park
Senior Living Statistics for Manhattan, Kansas
Average Senior Living Costs by Housing Type
The cost of senior housing in Manhattan varies depending on the type of accommodation and level of care. The following is the average monthly cost of senior housing based on data from 2023-2024.
| Housing Type | Average Monthly Cost |
|---|---|
| Assisted Living | $5,250 |
| Memory Care | $5,250 |
| Independent Living | $4,732 |
| Nursing Home: Private Room | $6,485 |
| Nursing Home: Semi-Private Room | $7,248 |
| Nursing Home: Studio | $6,364 |
| Nursing Home: One Bedroom | N/A |
| Nursing Home: Two Bedroom | N/A |
| Nursing Home: Detached Cottage | N/A |
Average Cost of Assisted Living in Manhattan
The following is the average monthly cost of assisted living in Manhattan based on 2024 data.
| City | Average Monthly Cost |
|---|---|
| Manhattan | $5,250 |
| Westmoreland | $4,589 |
| Alta Vista | $4,312 |
Here is how the average cost of assisted living in Manhattan compares to Kansas and the national average:
| Area | Average Monthly Cost |
|---|---|
| Manhattan | $5,250 |
| Kansas | $4,947 |
| United States | $4,546 |
Senior Living Availability in Manhattan
Number of senior living facilities in:
4
Manhattan
6
Surrounding Area
228
Kansas
Manhattan Senior Demographics
Based on information from 2023, here are some details around the population of Manhattan, such as age distribution for seniors, and racial diversity.
Population
Manhattan has a population of 54,287.- 51.9% Male
- 48.1% Female
Marital Status
- 32.8% Married
- 8.4% Divorced
- 56% Never Married
- 2.7% Widowed
Age
Seniors make up about 20.3% of the population.- 7% in their 50s
- 7% in their 60s
- 4.3% in their 70s
- 2% in their 80s
Diversity
- 79.7% White
- 5.3% Black
- 4.9% Asian
- 0.8% Native
- 0.3% Pacific
- 1.8% Identifying as Other
- 7.1% Mixed Race
- 7.7% Hispanic

