Best Assisted Living Facilities in Burlington, IA
Find local assisted living and retirement communities in the Burlington, IA area.
3 Communities were found near Burlington, IA
City
Care Type
- Adult Day Services
- Assisted Living
- Home Care
- Independent Living
- Memory Care
- Nursing Home
- Residential Care Home
- Senior Apartments
- Distance from City Center
- Highest Rating
- Name: A - Z
- Name: Z - A

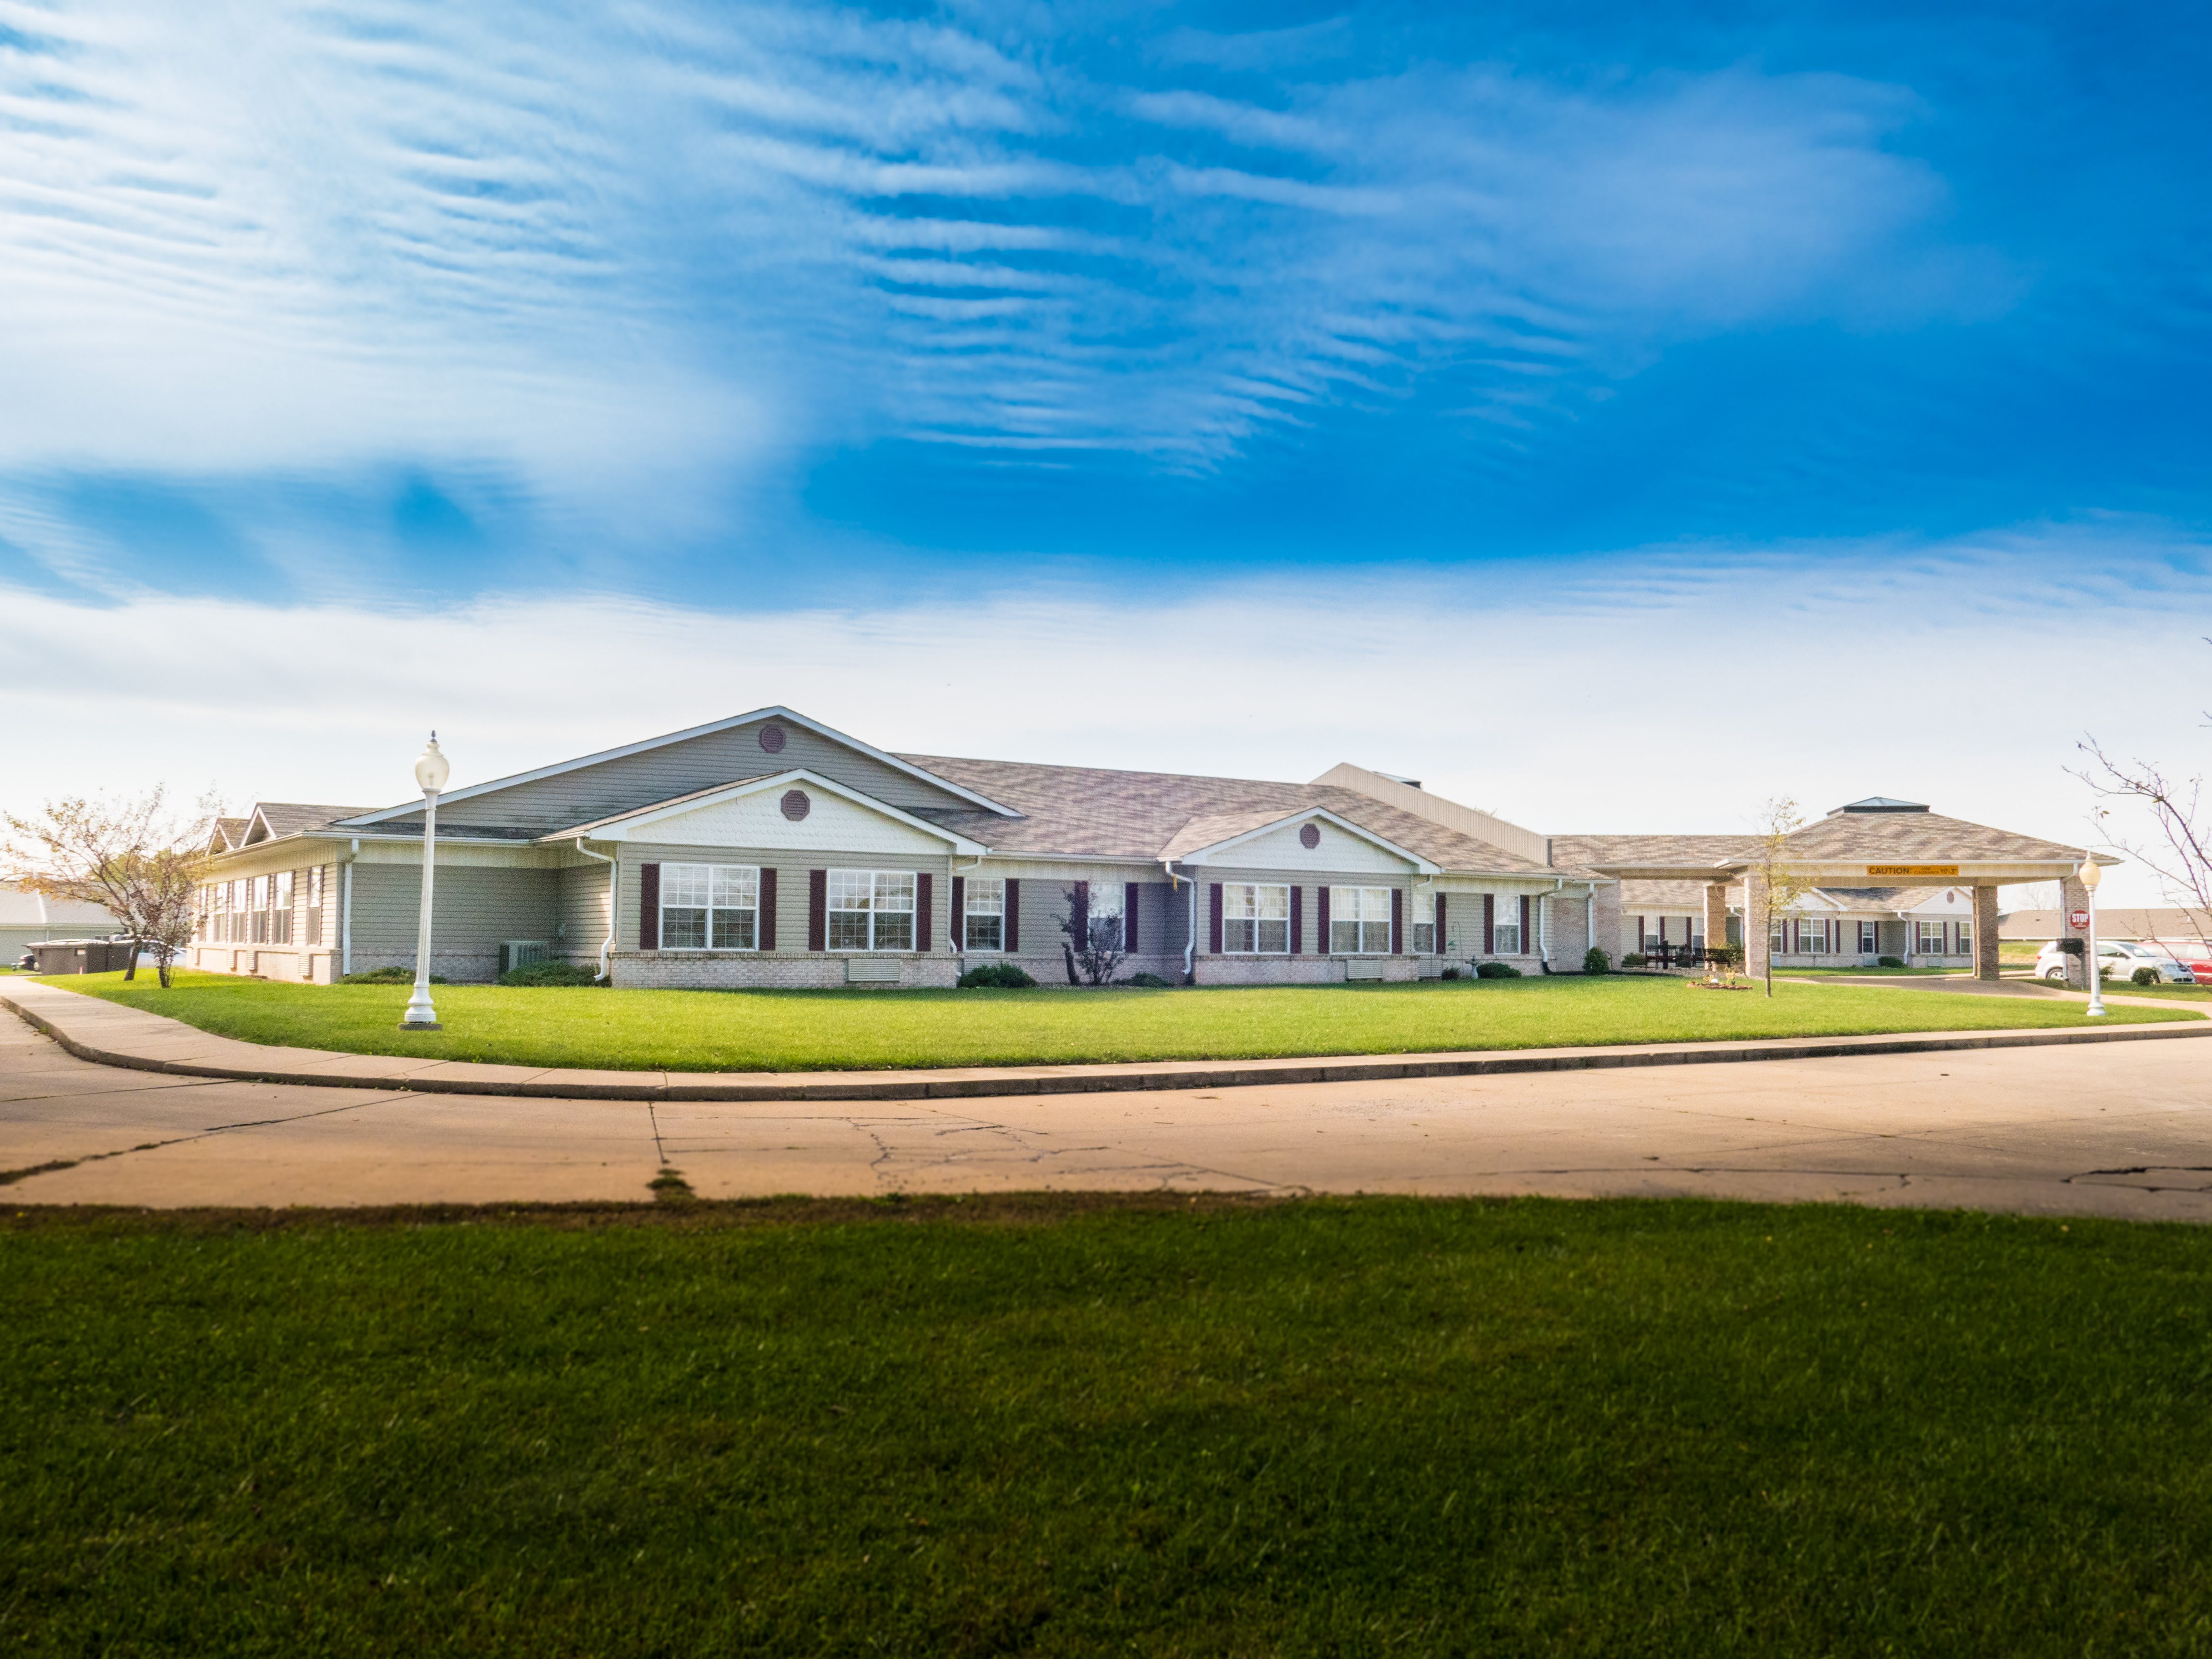
Ridgeview Assisted Living
4925 West Ave, Burlington, IA 52601 (2.3 mi from city center)
Assisted Living

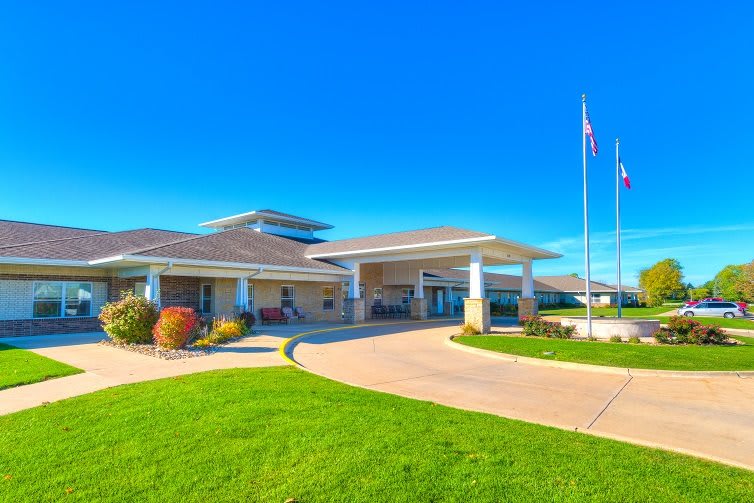
Addington Place of Burlington
5175 West Ave, Burlington, IA 52601 (2.4 mi from city center)
Assisted Living
Map of Assisted Living in Burlington
Find the right senior living community by location- Bickford of Burlington
- Ridgeview Assisted Living
- Addington Place of Burlington
Senior Living Statistics for Burlington, Iowa
Average Senior Living Costs by Housing Type
The cost of senior housing in Burlington varies depending on the type of accommodation and level of care. The following is the average monthly cost of senior housing based on data from 2023-2024.
| Housing Type | Average Monthly Cost |
|---|---|
| Assisted Living | $4,311 |
| Memory Care | $4,311 |
| Independent Living | $3,678 |
| Nursing Home: Private Room | $5,095 |
| Nursing Home: Semi-Private Room | $4,692 |
| Nursing Home: Studio | $4,707 |
| Nursing Home: One Bedroom | $5,416 |
| Nursing Home: Two Bedroom | N/A |
| Nursing Home: Detached Cottage | N/A |
Average Cost of Assisted Living in Burlington
The following is the average monthly cost of assisted living in Burlington based on 2024 data.
| City | Average Monthly Cost |
|---|---|
| Burlington | $4,311 |
| Winfield | $3,243 |
| Olds | $3,243 |
Here is how the average cost of assisted living in Burlington compares to Iowa and the national average:
| Area | Average Monthly Cost |
|---|---|
| Burlington | $4,311 |
| Iowa | $4,268 |
| United States | $4,546 |
Senior Living Availability in Burlington
Number of senior living facilities in:
3
Burlington
3
Surrounding Area
229
Iowa
Burlington Senior Demographics
Based on information from 2023, here are some details around the population of Burlington, such as age distribution for seniors, and racial diversity.
Population
Burlington has a population of 23,976.- 48.4% Male
- 51.6% Female
Marital Status
- 42.5% Married
- 17.8% Divorced
- 33.3% Never Married
- 6.3% Widowed
Age
Seniors make up about 42.9% of the population.- 12.6% in their 50s
- 15.8% in their 60s
- 9.1% in their 70s
- 5.4% in their 80s
Diversity
- 86.4% White
- 5.8% Black
- 1.5% Asian
- 0% Native
- 0% Pacific
- 0.8% Identifying as Other
- 5.5% Mixed Race
- 4.6% Hispanic

