10.7 Million U.S. Homes Owned by People 65+ Still Have Mortgages
Key Findings
- Roughly 10.7 million housing units nationwide are owned and occupied by someone 65 or older who still has a mortgage, according to Census data. This is about 1 in 5 mortgaged homes in the U.S.
- Wildwood-The Villages, Florida, Lake Havasu City-Kingman, Arizona, and Prescott Valley-Prescott, Arizona have the largest share of homes with mortgages owned and occupied by people 65 and older.
- Eagle Pass, Midland, and Odessa, Texas have the smallest share of mortgaged homes owned by 65-and-older homeowners. Among mortgaged housing units in these metros, 8 percent or less are owned by people 65 and older.
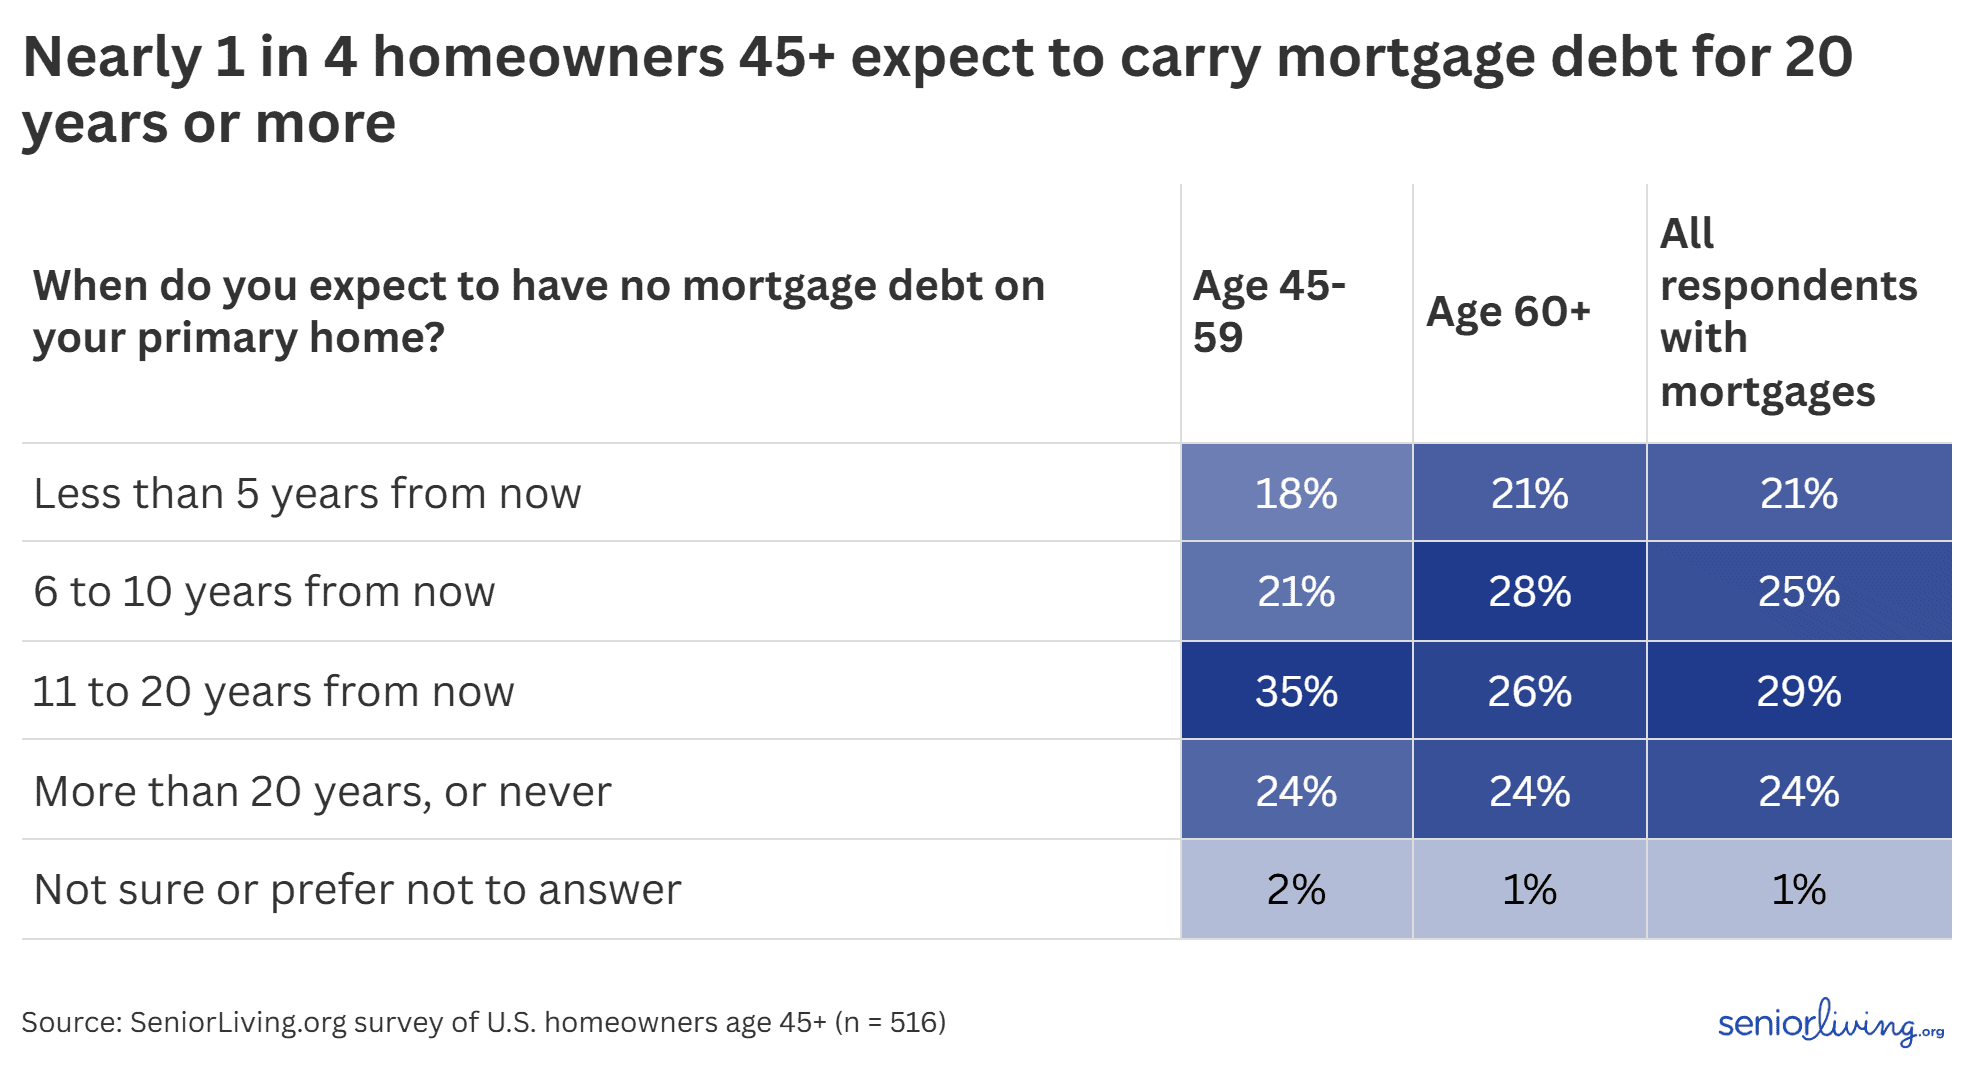
- 1 in 4 homeowners 45 and older with a mortgage say they'll need 20 or more years, or possibly forever, to pay it off.
- 40 percent expect mortgage debt to delay their retirement; that number climbs to 48 percent among women, compared with 34 percent among men.
- 69 percent of homeowners 45 and older have financially helped an adult child while still paying down their own mortgage, and 39 percent of those say offering help slowed their own mortgage payoff.
Why Retirees Are Still Paying Off Mortgages
Many homeowners today are carrying mortgage debt into their 60s, 70s, and 80s. For generations, the home was one asset retirees could count on as fully, finally theirs. That milestone hasn't disappeared, but for many Americans, a mortgage shapes when someone can stop working, how much they can help their own adult children, and where they can realistically afford to grow older.
To measure the impact of mortgage payments on retirement planning, we combined two data sources. The housing and metro-level figures below are drawn from the U.S. Census Bureau's 2024 American Community Survey, the most recent data available. Using this data, we ranked U.S. metros with the highest and lowest shares of homeowners aged 65 and older who still carry a mortgage. Layered on top is an original survey of 971 U.S. homeowners aged 45 and older to help explain the impact of paying down a mortgage as retirement approaches.
Is a Mortgage Payment in Retirement Actually Manageable?
About 10,731,833 housing units, or roughly 1 in 5 mortgaged homes in the United States, are owned and occupied by someone 65 or older, according to Census data. However, the typical monthly housing cost among older homeowners with mortgages is lower than the typical monthly costs across all age groups.
Yet, by most homeowners' own account, about 6 in 10 survey respondents call their mortgage payment completely or very manageable, and only a small share describe it as not at all manageable. But “affordable” and “unrestrictive” turned out to be two very different things once the survey asked about concrete consequences.
U.S. household debt hit a record $18.59 trillion in the third quarter of 2025, and today's rate environment makes some debts more expensive to carry. Average credit card APRs hover near 21 percent against a Social Security cost-of-living adjustment of just 2.8 percent, a gap flagged as a defining feature of retiree finances. Against that backdrop, a mortgage payment someone calls “manageable” may still be competing with rising costs everywhere else in the household budget.
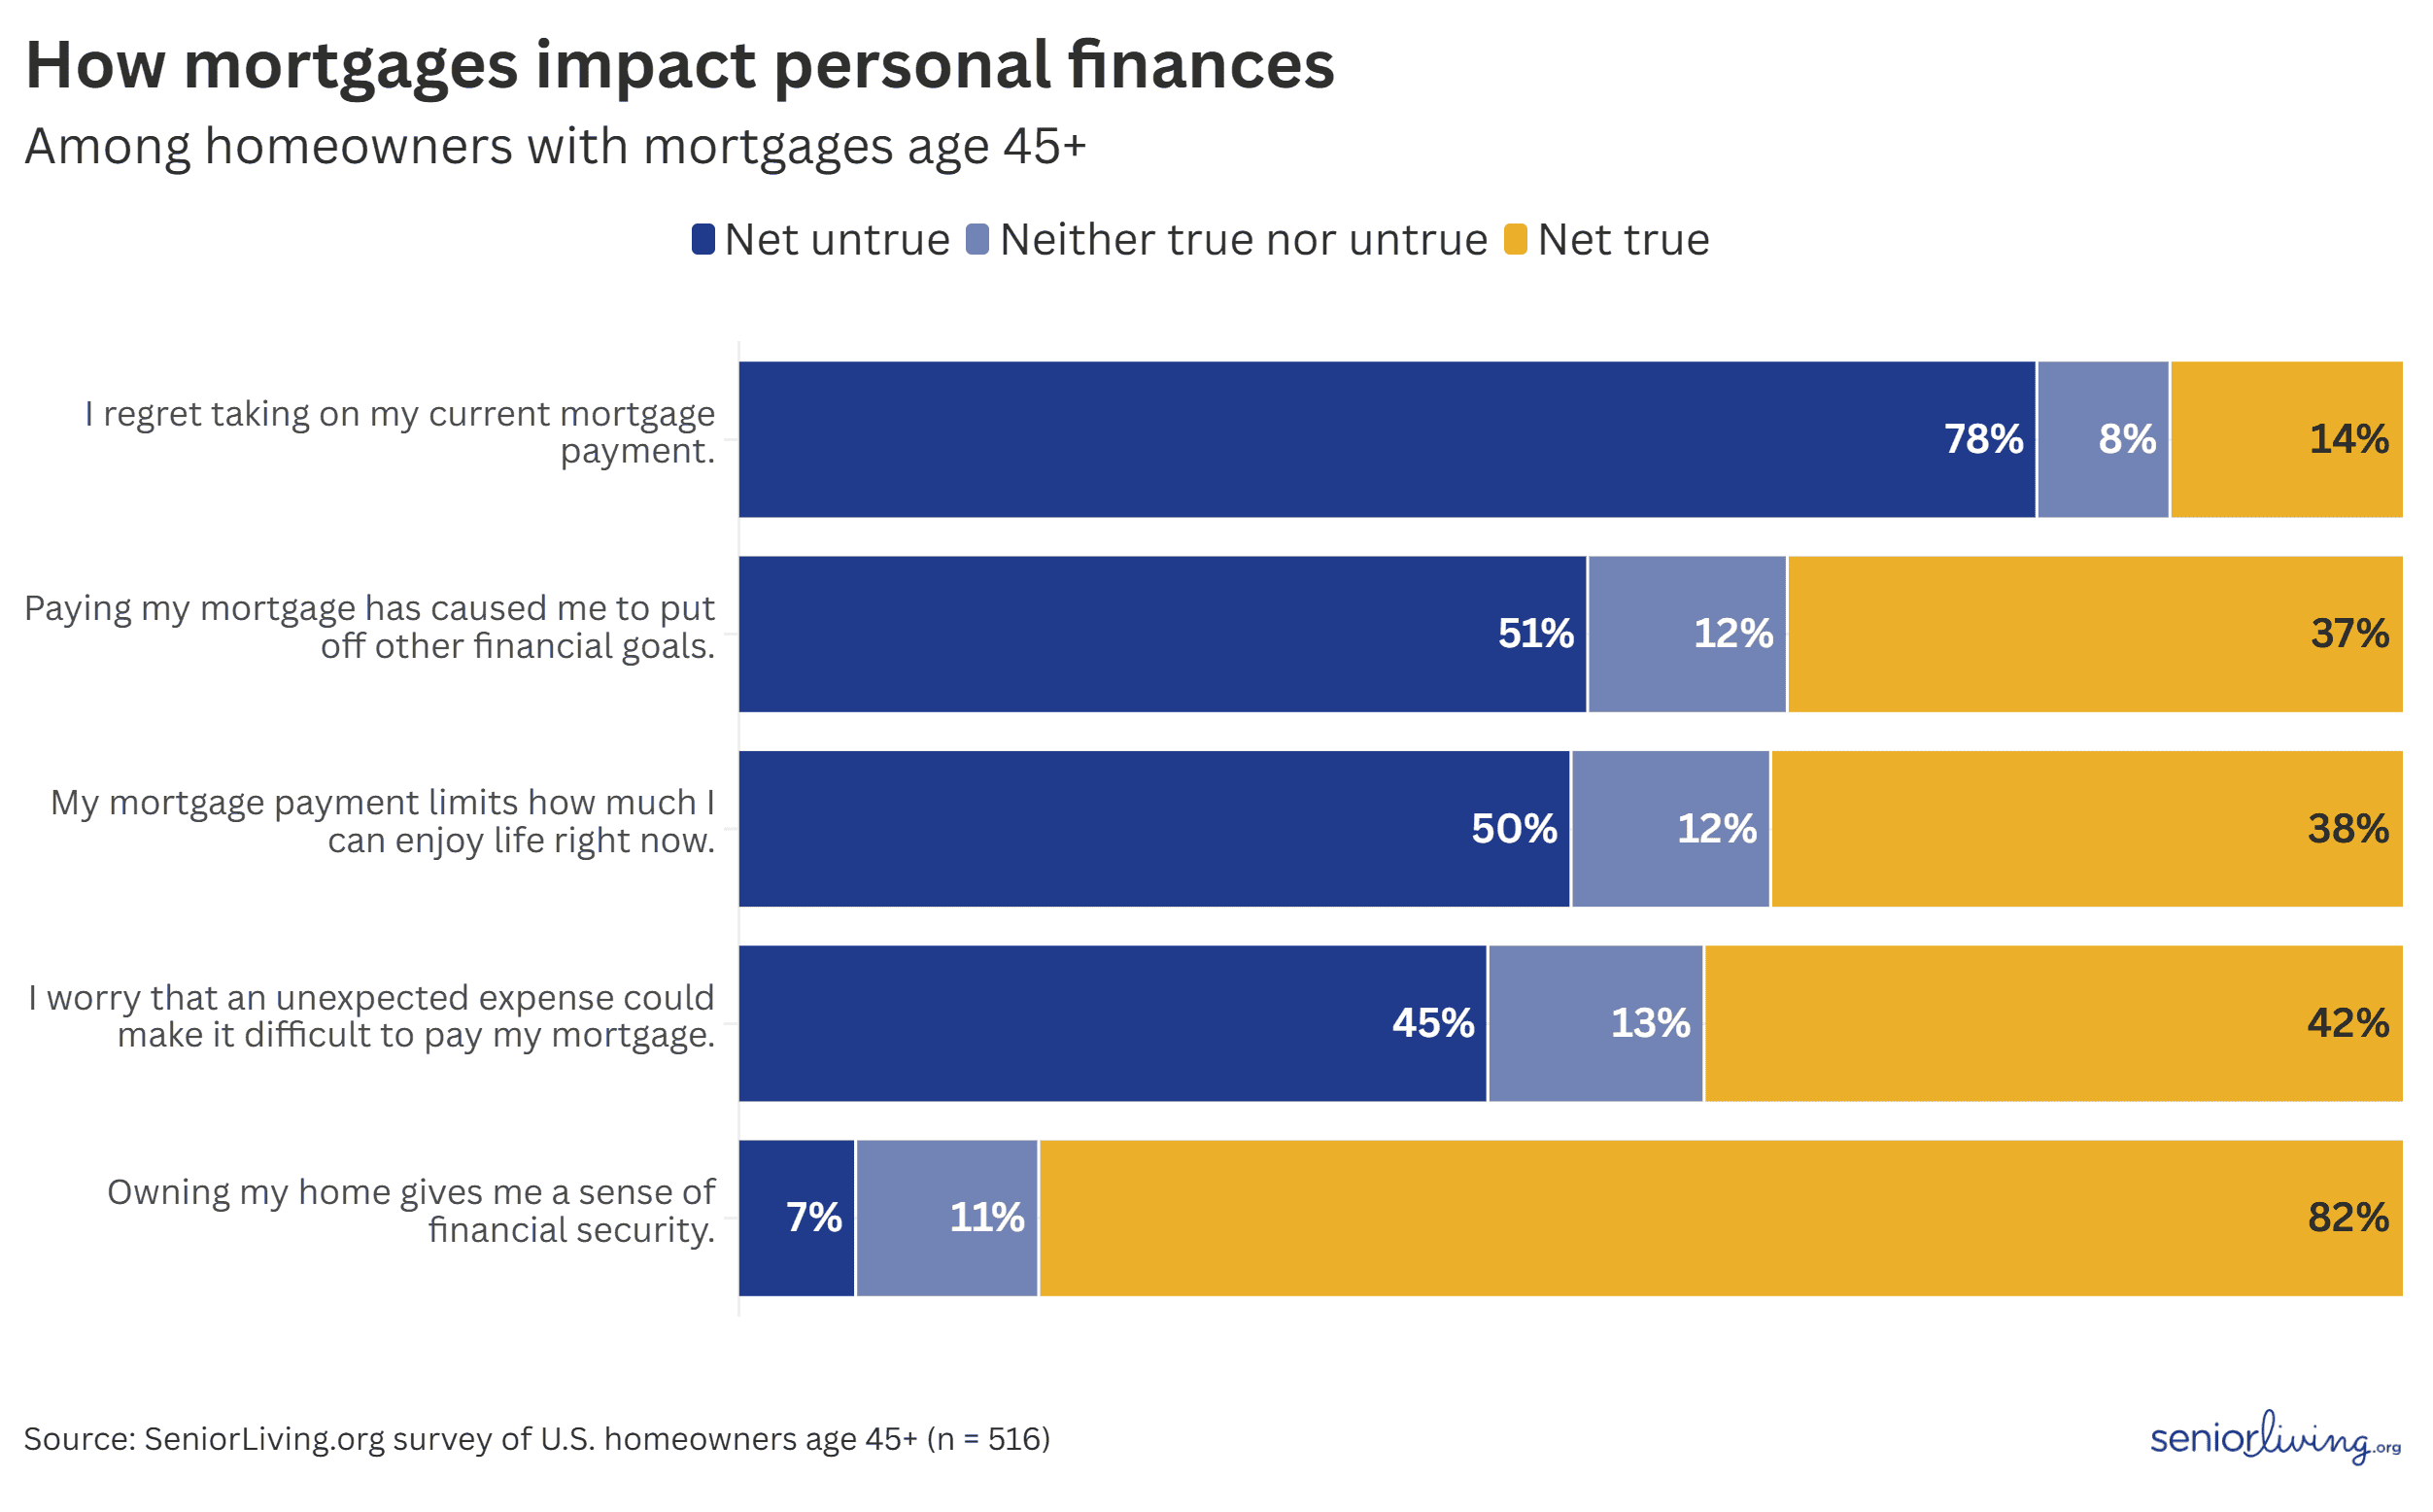
Half of survey respondents say their mortgage payment limits how much they can enjoy life right now. Fifty-one percent say it has caused them to put off other financial goals, and 42 percent worry an unexpected expense could make it difficult to make a mortgage payment. Those figures, drawn from a separate set of attitude questions, show a very different picture than the general manageability ratings above. More than half of adults aged 45 or older who currently have a mortgage say their mortgage will also affect when they’re able to retire.
Homeowners can experience their mortgage as limiting without regretting the decision to take it on. Even among people describing real restriction and worry, 82 percent still said owning their home gives them a sense of financial security, and 78 percent said they don't regret taking on their current mortgage.
Two patterns cut across these numbers: age and gender. Younger homeowners in the survey, those 45 to 59, report meaningfully more strain than those 60 and older: they're more likely to say their mortgage limits how much they can enjoy life, more likely to say it's caused them to postpone other financial goals, and more likely to worry an unexpected expense could make it difficult to pay. That tracks with a broader reality for that age group: bigger mortgage balances, more household debt, and more active financial support for adult children, all while trying to plan for retirement.
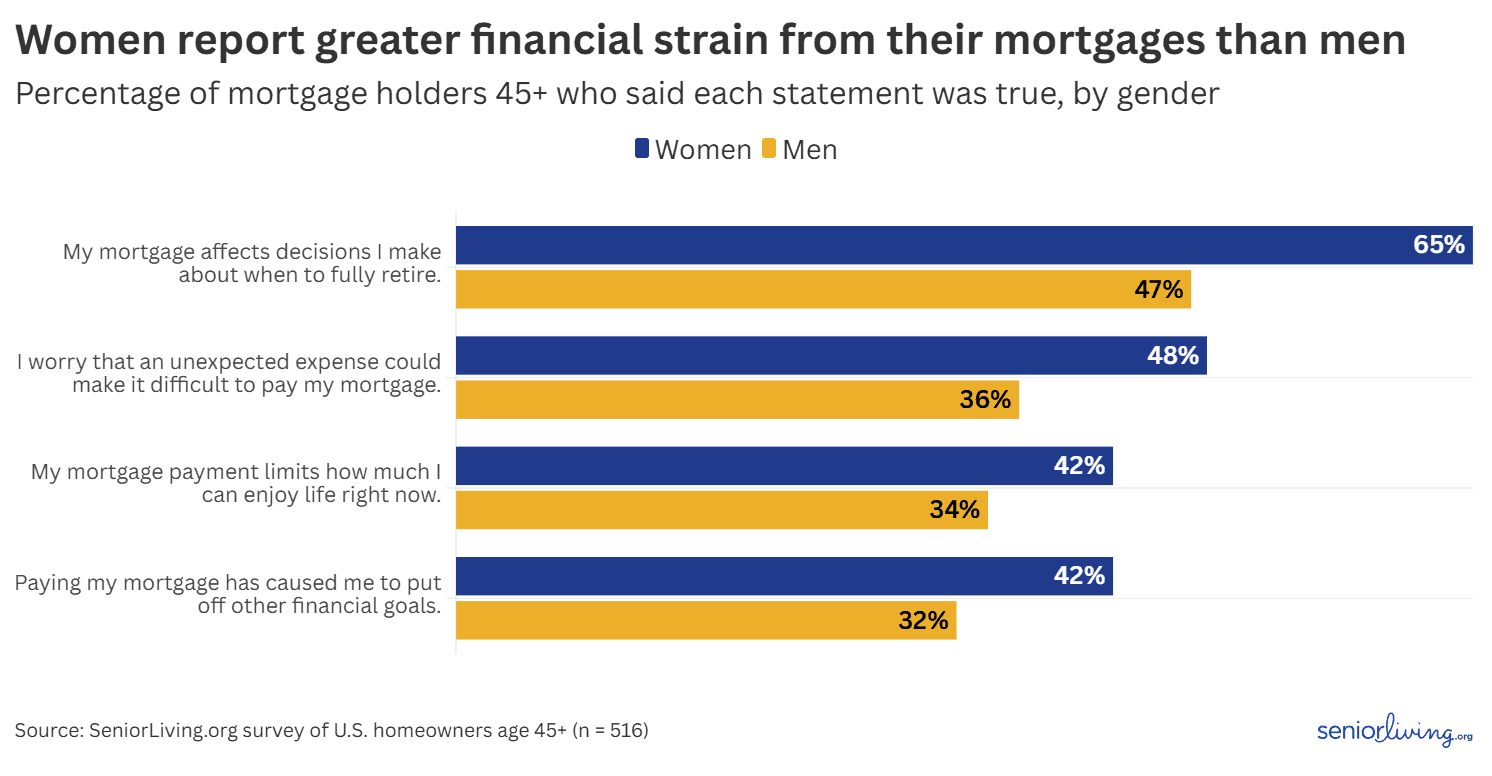
Women also report more strain than men, despite no significant difference in mortgage size or payment amount. They're more likely to say their mortgage has caused them to postpone other financial goals, more likely to worry an unexpected expense could derail payments, and considerably more likely to say their mortgage affects when they'll fully retire. The mortgage itself isn't larger for women; the experience of carrying it is.
Family obligations add to that picture, especially for younger homeowners. About seven in ten homeowners 45 and older say they've financially helped an adult child while paying down their own mortgage, and roughly half say they'd feel guilty prioritizing their own mortgage goals over a child's financial need. But that help rarely derails a payoff in any serious way: only about 6 percent of those who've helped say it delayed their mortgage a great deal, a reminder that family financial support is widespread but, for most, a background pressure rather than a defining one.
When Do Older Homeowners Expect To Pay Off Their Mortgages?
One in four homeowners 45 and older with a mortgage expect to be in mortgage debt for more than 20 years, or possibly forever, while they own their current home. The payoff timeline data below makes that mismatch between a manageable mortgage payment and a distant finish line clear.
A long payoff horizon isn't new among older homeowners, and it isn't going away. A survey of homeowners ages 60 to 70 found that 44 percent of Americans in that age range had a mortgage heading into retirement. While this finding is from 2018, our recent survey suggests it has only become more common since then.
Which Metro Areas Have the Most Homeowners 65+ With a Mortgage?
Wildwood-The Villages, Florida has the highest share of mortgaged homes owned and occupied by someone 65 or older, at 66.7 percent. In fact, nearly the entire top 20 list of such metro areas is dominated by Sun Belt retirement destinations and coastal vacation markets. That pattern makes sense once you consider who is actually moving to these places, and why.
Metros with the largest share of homes with mortgages owned and occupied by people 65 and older
| Rank | Metro | Percent of mortgaged housing units owned and occupied by people 65+ | Median monthly housing cost of mortgaged homes owned and occupied by people 65+ | Typical value of homes owned and occupied by people 65+ |
|---|---|---|---|---|
| 1 | Wildwood-The Villages, FL | 66.7% | $1,125 | $364,290 |
| 2 | Lake Havasu City-Kingman, AZ | 43.7% | $895 | $303,060 |
| 3 | Prescott Valley-Prescott, AZ | 42.8% | $1,112 | $399,436 |
| 4 | Punta Gorda, FL | 42.6% | $1,095 | $322,367 |
| 5 | Homosassa Springs, FL | 41.1% | $844 | $252,817 |
| 6 | Hilton Head Island-Bluffton-Port Royal, SC | 38.0% | $1,265 | $407,733 |
| 7 | Sebastian-Vero Beach-West Vero Corridor, FL | 37.5% | $1,110 | $323,236 |
| 8 | Barnstable Town, MA | 36.5% | $1,508 | $576,361 |
| 9 | Santa Fe, NM | 36.4% | $1,260 | $346,613 |
| 10 | Naples-Marco Island, FL | 36.1% | $1,435 | $444,792 |
| 11 | Myrtle Beach-Conway-North Myrtle Beach, SC | 35.3% | $891 | $271,720 |
| 12 | North Port-Bradenton-Sarasota, FL | 34.7% | $1,210 | $370,848 |
| 13 | Ocala, FL | 34.6% | $900 | $256,444 |
| 14 | Sebring, FL | 34.5% | $781 | $224,004 |
| 15 | Grants Pass, OR | 33.9% | $1,066 | $367,786 |
| 16 | San Luis Obispo-Paso Robles, CA | 33.3% | $1,535 | $708,278 |
| 17 | Brunswick-St. Simons, GA | 32.9% | $870 | $229,879 |
| 18 | Cape Coral-Fort Myers, FL | 32.0% | $1,184 | $340,394 |
| 19 | St. George, UT | 31.3% | $1,142 | $442,517 |
| 20 | Santa Cruz-Watsonville, CA | 30.9% | $1,797 | $903,798 |
While some older homeowners are stuck finishing a mortgage they started decades ago, others are voluntarily starting a new one to fund a retirement lifestyle purchase. Thus, the top of the list belongs to Wildwood-The Villages, Florida, where a striking 66.7 percent of mortgaged homes are owned and occupied by someone 65 or older. The Villages is one of the largest age-restricted active-adult communities in the country, purpose-built for retirees, and much of what's showing up in this data likely reflects new mortgages taken on for newly built homes purchased in retirement, rather than decades-old loans people are still working to pay off from earlier in their careers.
Lake Havasu City-Kingman and Prescott Valley-Prescott, both in Arizona, round out the second and third spots. These are classic Sun Belt and snowbird migration corridors, relatively affordable compared with coastal retirement markets, with typical home values under $400,000. They are popular landing spots for retirees relocating from higher-cost states like California, often financing the move with a new mortgage even after selling a paid-off home elsewhere.
Further down the list, Hilton Head Island-Bluffton-Port Royal, South Carolina, and Naples-Marco Island, Florida are higher-end retirement and vacation markets where the draw is lifestyle rather than affordability. In these Southern metros, second-home and retirement buyers are financing higher-value coastal property well into their 60s and 70s.
In some cases, the metros with the highest rates of homeowners still paying off mortgages in their 60s are places people move to for retirement. They are not necessarily the same places where people age in place. That distinction matters for the next set of metros on the opposite end of the ranking.
Which Metro Areas Have the Fewest Homeowners 65+ With a Mortgage?
Eagle Pass, Texas, has the country's lowest share of mortgaged homes owned and occupied by people 65 and older, at 5.7 percent, followed closely by Midland and Odessa, Texas. The metro areas at the bottom of this list split into two distinct stories: young, fast-growing boomtowns and markets where older residents are more likely to own their homes outright rather than still carry a mortgage.
Metros with the smallest share of homes with mortgages owned and occupied by people 65 and older
| Rank | Metro | Percent of mortgaged housing units owned and occupied by people 65+ | Median monthly housing cost of mortgaged homes owned and occupied by people 65+ | Typical value of homes owned and occupied by people 65+ |
|---|---|---|---|---|
| 1 | Eagle Pass, TX | 5.7% | $812 | $168,380 |
| 2 | Midland, TX | 7.2% | $1,053 | $266,568 |
| 3 | Odessa, TX | 8.1% | $1,014 | $195,070 |
| 4 | McAllen-Edinburg-Mission, TX | 10.3% | $776 | $161,267 |
| 5 | Fargo, ND-MN | 10.3% | $957 | $256,856 |
| 6 | Laredo, TX | 10.4% | $865 | $167,319 |
| 7 | Provo-Orem-Lehi, UT | 11.3% | $1,221 | $425,315 |
| 8 | Sioux Falls, SD-MN | 11.9% | $996 | $238,486 |
| 9 | Grand Island, NE | 11.9% | $928 | $213,392 |
| 10 | Minot, ND | 12.3% | $1,035 | $215,431 |
| 11 | Houma-Bayou Cane-Thibodaux, LA | 12.4% | $788 | $173,066 |
| 12 | St. Cloud, MN | 12.5% | $1,036 | $255,106 |
| 13 | Logan, UT-ID | 12.6% | $1,009 | $378,994 |
| 14 | Clarksville, TN-KY | 12.7% | $817 | $204,479 |
| 15 | Manhattan, KS | 12.8% | $991 | $207,958 |
| 16 | Ogden, UT | 13.0% | $1,180 | $430,844 |
| 17 | Lafayette, LA | 13.1% | $920 | $186,915 |
| 18 | Sioux City, IA-NE-SD | 13.1% | $846 | $199,879 |
| 19 | San Angelo, TX | 13.2% | $906 | $214,814 |
| 20 | Austin-Round Rock-San Marcos, TX | 13.3% | $1,343 | $374,896 |
Midland and Odessa, Texas, both anchors of the Permian Basin oil-and-gas region, rank second and third. In these metros, older owner-occupants make up just 7.2 percent and 8.1 percent of mortgaged homes, respectively. These areas have young, working-age populations drawn in by energy-sector jobs. The low share of older mortgage payers almost certainly reflects a smaller retiree population overall, rather than local seniors paying down their mortgages faster than everyone else.
Eagle Pass and McAllen-Edinburg-Mission, both Texas border metros, ranked first and fourth. The cities have young, fast-growing populations and lower typical home values of $168,380 and $161,267, respectively. It's tempting to assume low cost of living explains the low share of older mortgage holders here, but that’s not the only factor: several of the metros with the very lowest mortgage costs for 65-and-older homeowners nationally (detailed below) are still popular with retirees. Population age structure, not affordability alone, appears to be the deciding factor.
Provo-Orem-Lehi, Utah, and Austin-Round Rock-San Marcos, Texas, round out the list at number seven and twenty. These are two of the fastest-growing, youngest-skewing metros in the country over the past decade. Provo's demographic profile skews toward young families, while Austin's growth has been driven heavily by tech-sector in-migration.
Which Cities Have the Highest and Lowest Mortgage Payments for Homeowners 65+?
Older homeowners with mortgages in San Jose, California have the highest median monthly housing payments at $2,088, nearly double the $1,138 national median for that age group. Nearly all of the top 10 highest-cost metros for mortgage holders 65 and older are the country's best-known expensive coastal and tech-hub markets.
Metros with the highest monthly housing costs for mortgaged homes owned and occupied by people 65+
| Metro | Median monthly housing cost of mortgaged homes owned and occupied by people 65+ | Typical value of homes owned and occupied by people 65+ |
|---|---|---|
| San Jose-Sunnyvale-Santa Clara, CA | $2,088 | $1,114,243 |
| Urban Honolulu, HI | $1,997 | $817,966 |
| New York-Newark-Jersey City, NY-NJ | $1,983 | $512,697 |
| San Francisco-Oakland-Fremont, CA | $1,929 | $930,234 |
| Napa, CA | $1,915 | $838,233 |
| Kahului-Wailuku, HI | $1,901 | $819,238 |
| Bridgeport-Stamford-Danbury, CT | $1,823 | $446,996 |
| Santa Cruz-Watsonville, CA | $1,797 | $903,798 |
| Los Angeles-Long Beach-Anaheim, CA | $1,783 | $761,149 |
| San Diego-Chula Vista-Carlsbad, CA | $1,778 | $744,444 |
San Jose's median monthly cost of $2,088 for mortgage holders 65 and older is nearly double the national senior median of $1,138. Decades of home-value inflation across Silicon Valley mean that even long-tenured owners in the region carry unusually large balances relative to almost anywhere else in the country. Similarly, in Honolulu, island geography sharply constrains housing supply. A meaningful share of older residents of the island state are financing homes purchased well after their prime earning years, rather than paying down loans taken out decades earlier.
These are also the metros where cost burden, the well-documented risk of spending an outsized share of income on housing, is likely most acute for anyone without substantial retirement savings or home equity built up before a move or refinance. That risk isn't hypothetical: reporting on Joint Center for Housing Studies and Urban Institute data found that a remarkable 97 percent of lower-income older mortgage holders, defined as those earning under $25,000 a year, are cost-burdened, spending 30 percent or more of their income on housing.
The lowest-cost metros for older mortgage holders overall are concentrated almost entirely in the small-city Midwest and Appalachia. Terre Haute, Indiana has the lowest median monthly housing payment for homeowners with mortgages 65 and older, at $543.
Metros with the lowest monthly housing costs for mortgaged homes owned and occupied by people 65+
| Metro | Median monthly housing cost of mortgaged homes owned and occupied by people 65+ | Typical value of homes owned and occupied by people 65+ |
|---|---|---|
| Terre Haute, IN | $543 | $140,514 |
| Muncie, IN | $589 | $130,463 |
| Beckley, WV | $594 | $137,367 |
| Lafayette-West Lafayette, IN | $611 | $164,533 |
| Charleston, WV | $612 | $144,569 |
| Huntington-Ashland, WV-KY-OH | $612 | $142,849 |
| Weirton-Steubenville, WV-OH | $616 | $145,630 |
| Kokomo, IN | $617 | $153,093 |
| Parkersburg-Vienna, WV | $621 | $162,725 |
| Jonesboro, AR | $629 | $163,986 |
Terre Haute and Muncie, Indiana, along with Beckley, Charleston, Huntington-Ashland, and Weirton-Steubenville in West Virginia, all post median monthly housing costs for mortgage holders 65 and older between $543 and $629, roughly half the $1,138 national median for that age group. These are metros with slower population growth, in some cases outright decline, lower overall housing demand, and typical home values well under $165,000. It's a very different context here than in the low-share metro areas covered earlier in this article: low cost here can coexist with a meaningful older population, one that simply faces far lower housing costs than their counterparts in coastal retirement destinations.
The Bottom Line: What Rising Mortgage Debt Means for Retirement
Carrying a mortgage into your 60s, 70s, or beyond is common because home values have climbed faster than many people can pay off early. Today, the cost of living and family financial pressures, such as helping adult children and grandchildren, may weigh more heavily on today’s seniors than they did in the past.
As many retirees carry mortgage debt into retirement, it may reshape not only their retirement timelines but also what they pass down to the next generation. For homeowners weighing these tradeoffs, it may help to consider whether their current home and its costs still match the life they want in retirement. Depending on lifestyle and financial goals, staying in a current home, downsizing, or relocating to a new city altogether could offer more manageable housing costs.
Methodology
This analysis combines U.S. Census Bureau data with an original survey.
For the housing figures, seniorliving.org analyzed American Community Survey (ACS) 2024 one-year tables B25027 (mortgage status by age of householder) and B25077 (median home value) for national figures. Metro-level estimates of home values and mortgage payments by age were calculated from the 2024 ACS five-year Public Use Microdata Sample (PUMS), restricted to owner-occupied units reporting a mortgage and weighted using Census housing-unit weights. Because PUMS data is reported by Public Use Microdata Area (PUMA) rather than metro area, PUMAs were matched to metropolitan statistical areas using a 2020 PUMA-to-2023 MSA crosswalk; PUMAs spanning more than one metro were counted in each, and PUMAs without a metro match were excluded from metro-level figures but retained in national totals.
Because PUMS reports values in ranges rather than exact figures, we estimated medians using linear interpolation within the range containing the 50th percentile. “Homeowners age 65 and older” refers to housing units where the householder is 65 or older, not necessarily every resident of the home. Metro rankings reflect point estimates that were not tested for statistical significance, and the one-year ACS tables (2024 conditions) and five-year PUMS (data pooled from 2020 through 2024) cover different reference periods, so read results as estimates rather than precise counts.
For the survey findings, seniorliving.org conducted an online survey of 971 U.S. adults who are homeowners age 45 and older, fielded August 27 through August 30, 2026, examining how mortgage debt intersects with housing, financial obligations, and retirement. 516 respondents currently had mortgages on their homes. We recruited participants through an online research panel and analyzed only completed responses from eligible respondents; we applied no statistical weighting. At the full sample size, the margin of error is approximately ±2.6 percentage points at the 95 percent confidence level; estimates based on subgroups or questions answered by fewer respondents have a wider margin of error.