Best Assisted Living Facilities in Black River Falls, WI
Find local assisted living and retirement communities in the Black River Falls, WI area.
3 Communities were found near Black River Falls, WI
City
Care Type
- Adult Day Services
- Assisted Living
- Home Care
- Independent Living
- Memory Care
- Nursing Home
- Residential Care Home
- Senior Apartments
- Distance from City Center
- Highest Rating
- Name: A - Z
- Name: Z - A

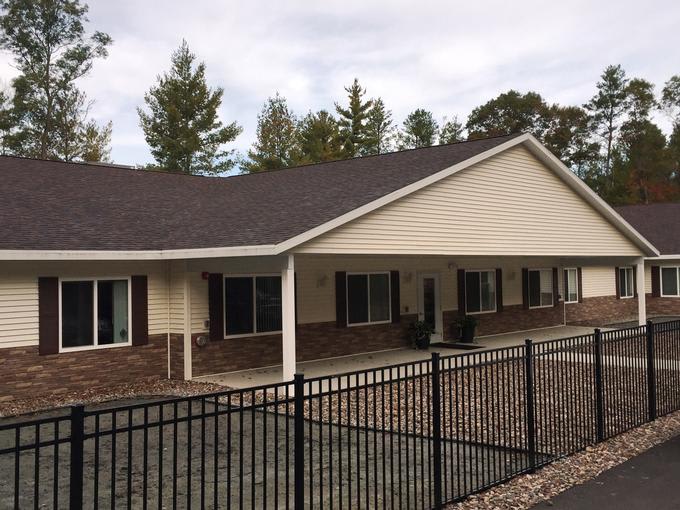
Country Terrace Assisted Living II - Black River Falls
642 E 3rd St, Black River Falls, WI 54615 (0.6 mi from city center)
Assisted Living

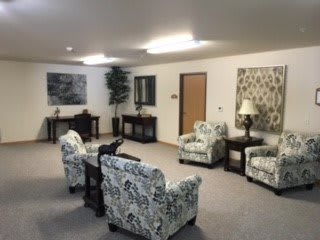
Country Terrace Assisted Living-CT6
525 E Second St, Black River Falls, WI 54615 (0.9 mi from city center)
Assisted Living
Map of Assisted Living in Black River Falls
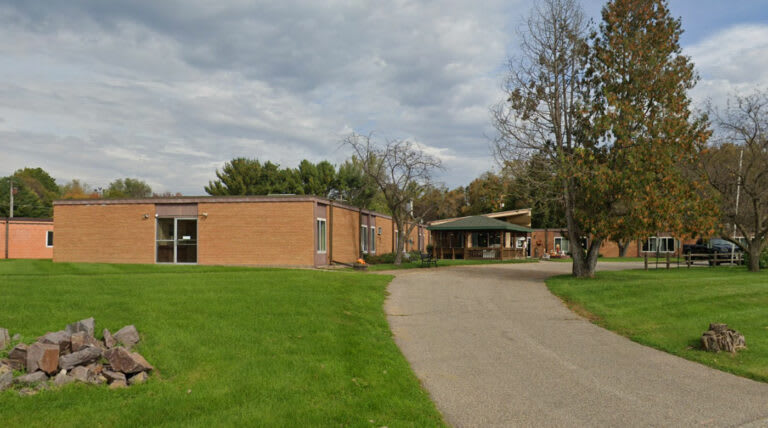
Find the right senior living community by location- Meadowbrook at Black River Falls
- Country Terrace Assisted Living II - Black River Falls
- Country Terrace Assisted Living-CT6
Senior Living Statistics for Black River Falls, Wisconsin
Average Senior Living Costs by Housing Type
The cost of senior housing in Black River Falls varies depending on the type of accommodation and level of care. The following is the average monthly cost of senior housing based on data from 2023-2024.
| Housing Type | Average Monthly Cost |
|---|---|
| Assisted Living | $4,475 |
| Memory Care | $4,513 |
| Independent Living | $3,787 |
| Nursing Home: Private Room | $5,209 |
| Nursing Home: Semi-Private Room | $5,296 |
| Nursing Home: Studio | $4,725 |
| Nursing Home: One Bedroom | $4,809 |
| Nursing Home: Two Bedroom | N/A |
| Nursing Home: Detached Cottage | N/A |
Average Cost of Assisted Living in Black River Falls
The following is the average monthly cost of assisted living in Black River Falls based on 2024 data.
| City | Average Monthly Cost |
|---|---|
| Black River Falls | $4,475 |
| Tomah | $3,827 |
| Wyeville | $3,065 |
Here is how the average cost of assisted living in Black River Falls compares to Wisconsin and the national average:
| Area | Average Monthly Cost |
|---|---|
| Black River Falls | $4,475 |
| Wisconsin | $4,225 |
| United States | $4,546 |
Senior Living Availability in Black River Falls
Number of senior living facilities in:
3
Black River Falls
0
Surrounding Area
660
Wisconsin
Black River Falls Senior Demographics
Based on information from 2023, here are some details around the population of Black River Falls, such as age distribution for seniors, and racial diversity.
Population
Black River Falls has a population of 3,488.- 47.7% Male
- 52.3% Female
Marital Status
- 42.8% Married
- 21.9% Divorced
- 23.2% Never Married
- 12.1% Widowed
Age
Seniors make up about 45.6% of the population.- 8.6% in their 50s
- 21.1% in their 60s
- 9.2% in their 70s
- 6.7% in their 80s
Diversity
- 91.9% White
- 0.3% Black
- 0% Asian
- 3% Native
- 0% Pacific
- 0.5% Identifying as Other
- 4.2% Mixed Race
- 1.3% Hispanic

