Best Assisted Living Facilities in Minot, ND
Find local assisted living and retirement communities in the Minot, ND area.
- Adult Day Services
- Assisted Living
- Home Care
- Independent Living
- Memory Care
- Nursing Home
- Residential Care Home
- Senior Apartments
- Distance from City Center
- Highest Rating
- Name: A - Z
- Name: Z - A
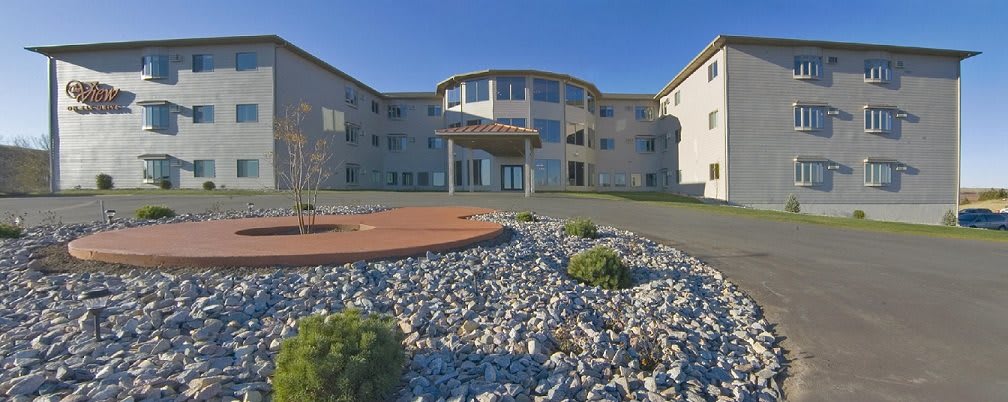
The View
2905 Elk Dr, Minot, ND 58701 (0.9 mi from city center)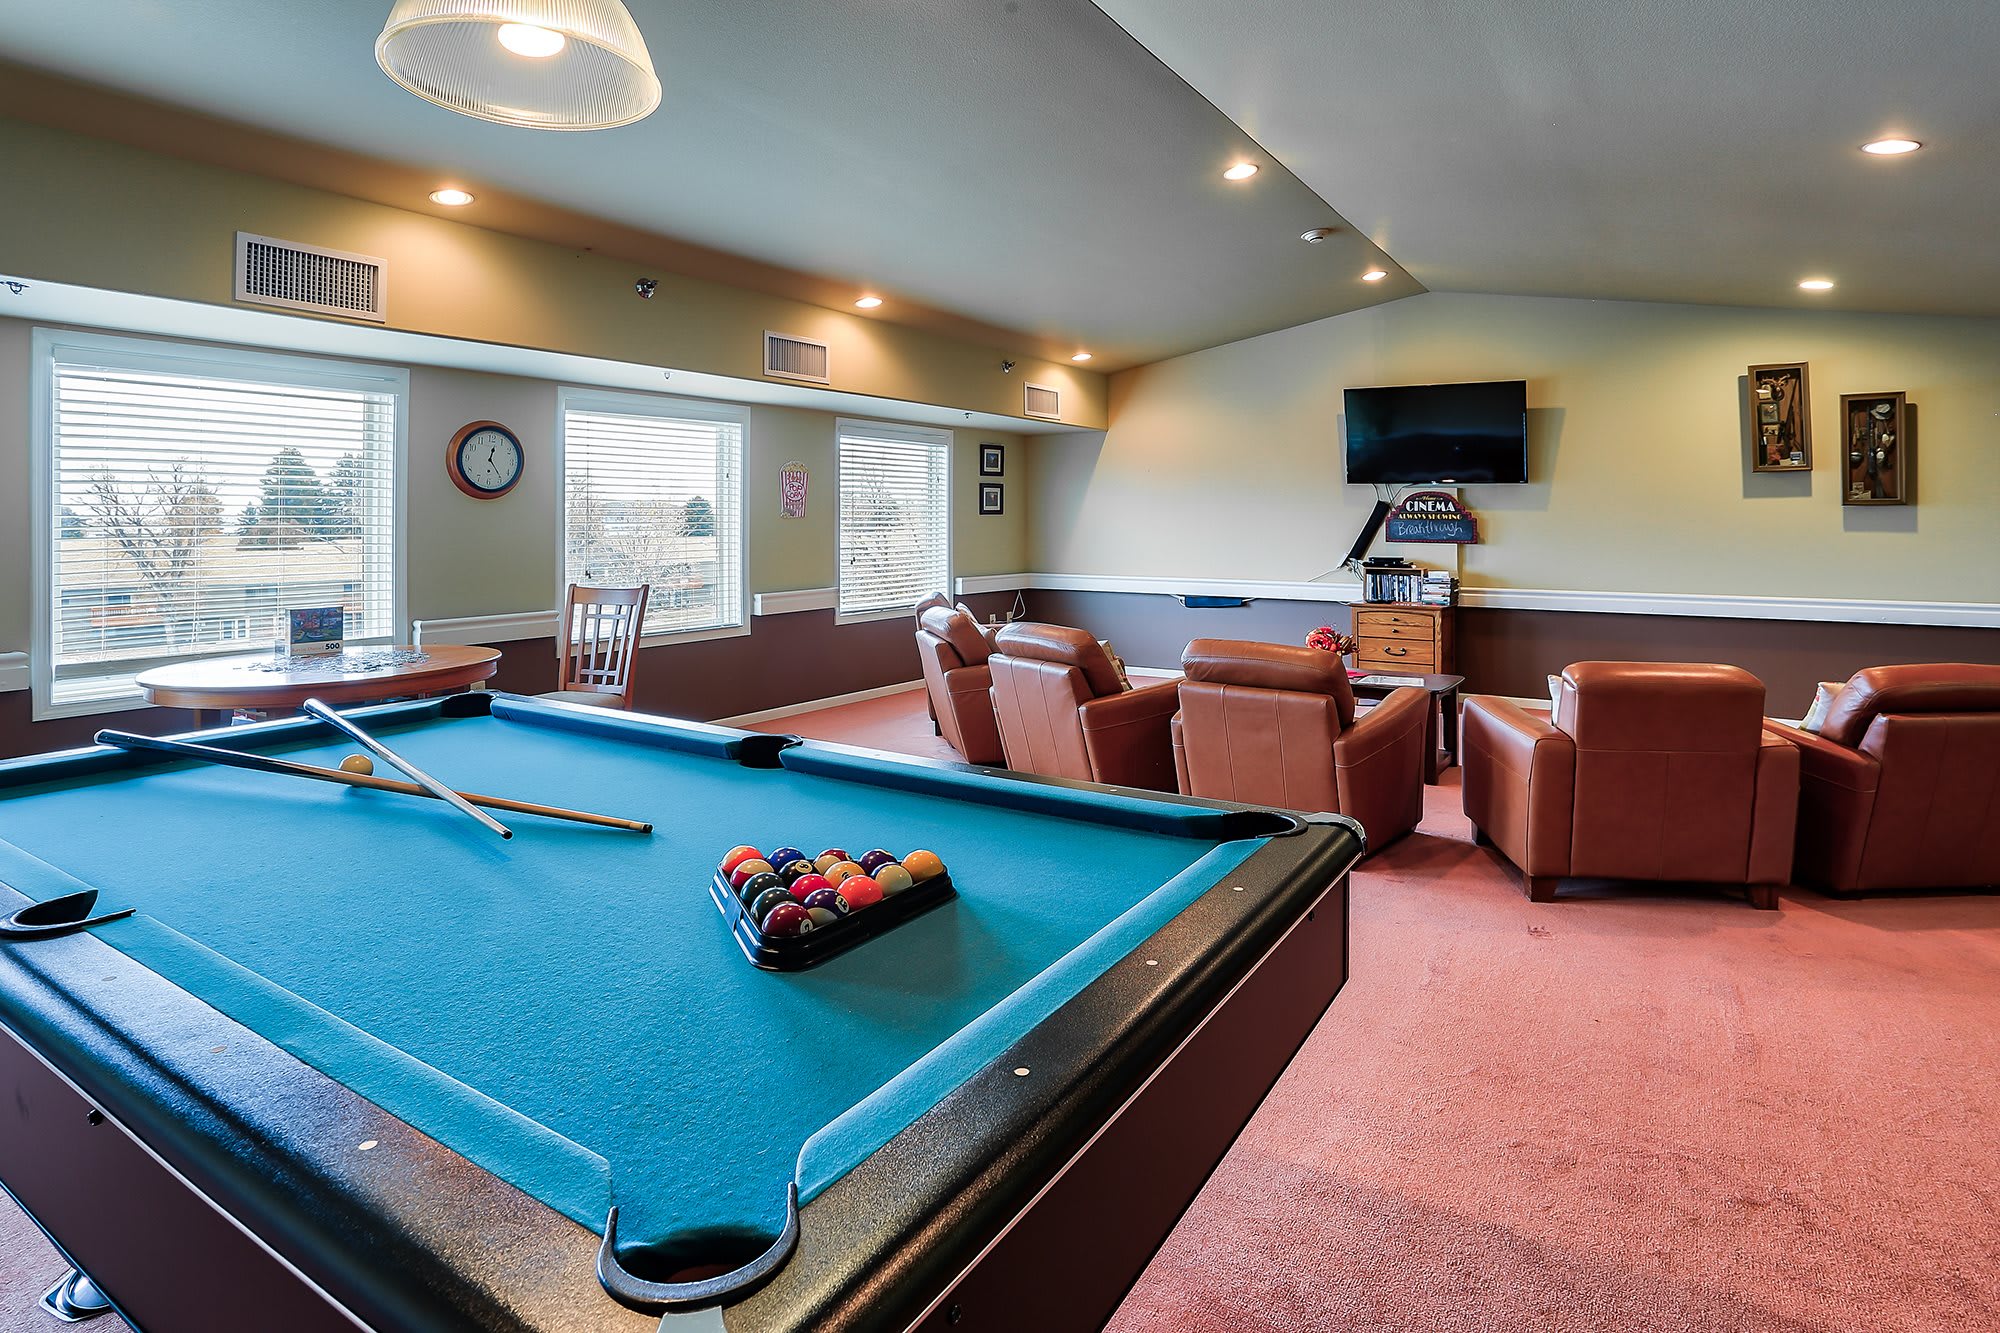
Minot Lodge Senior Living
601 24th Ave SW, Minot, ND 58701 (2.4 mi from city center)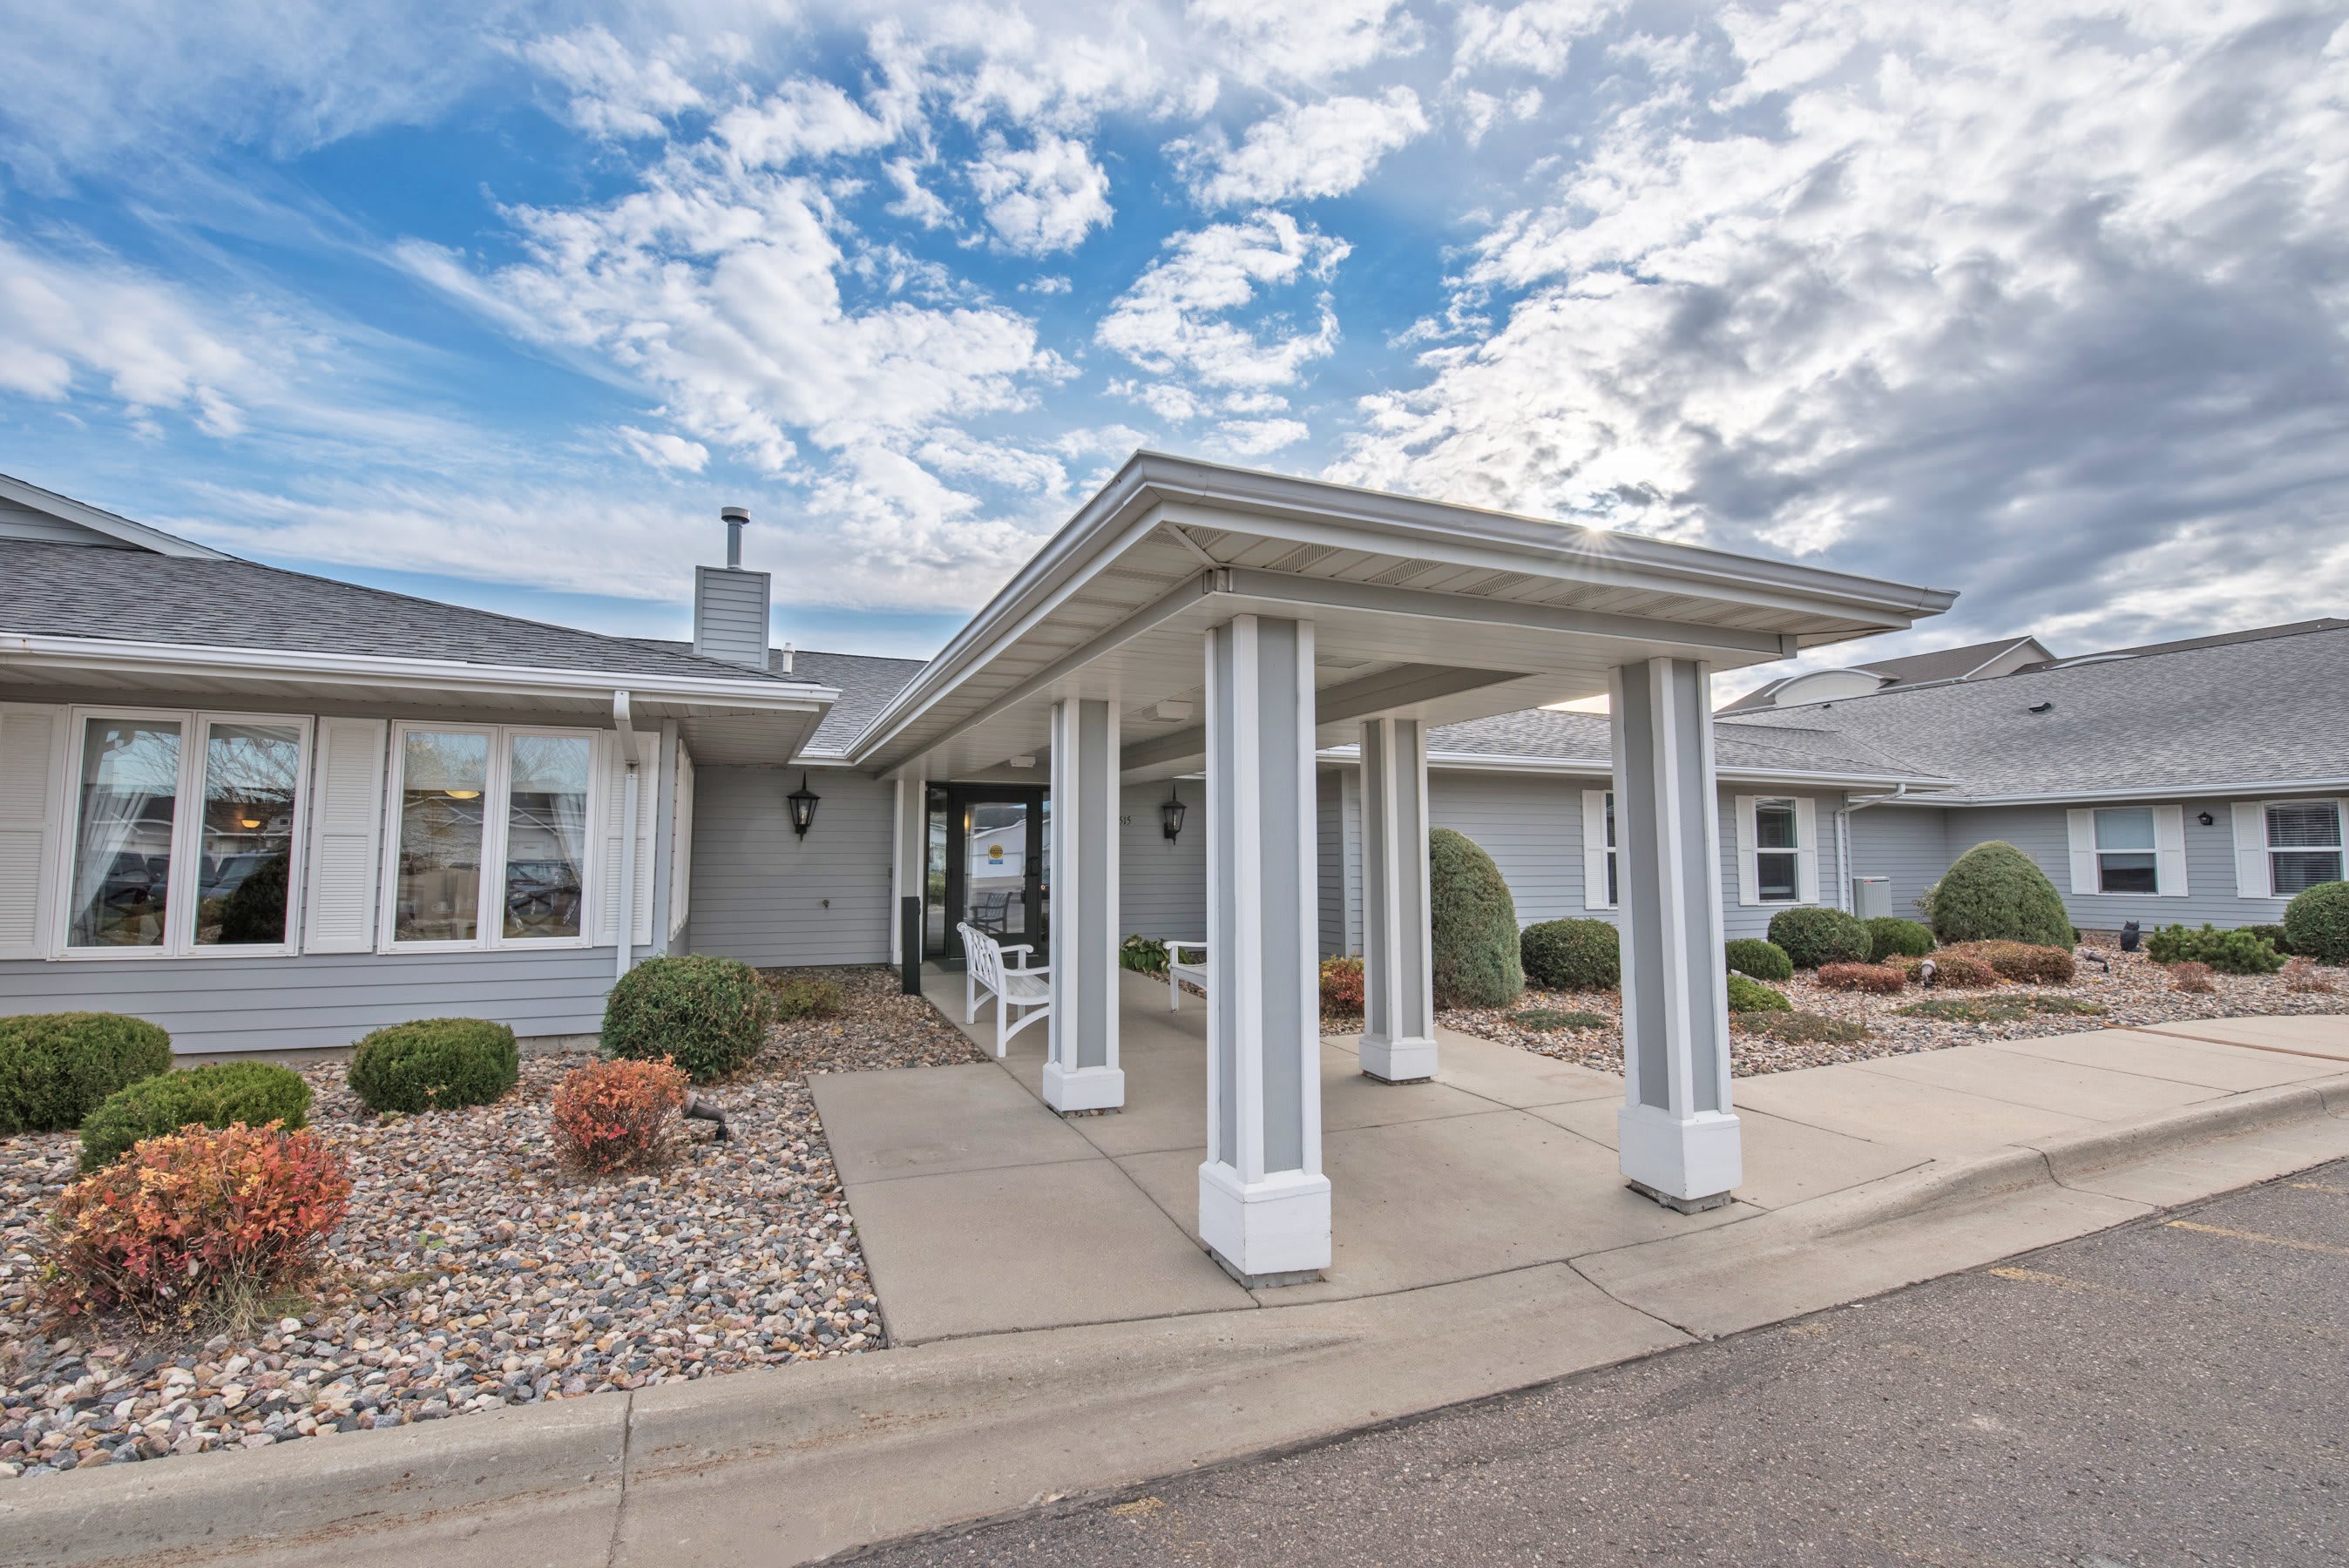
Elison of Minot
3515 10th St SW, Minot, ND 58701 (3 mi from city center)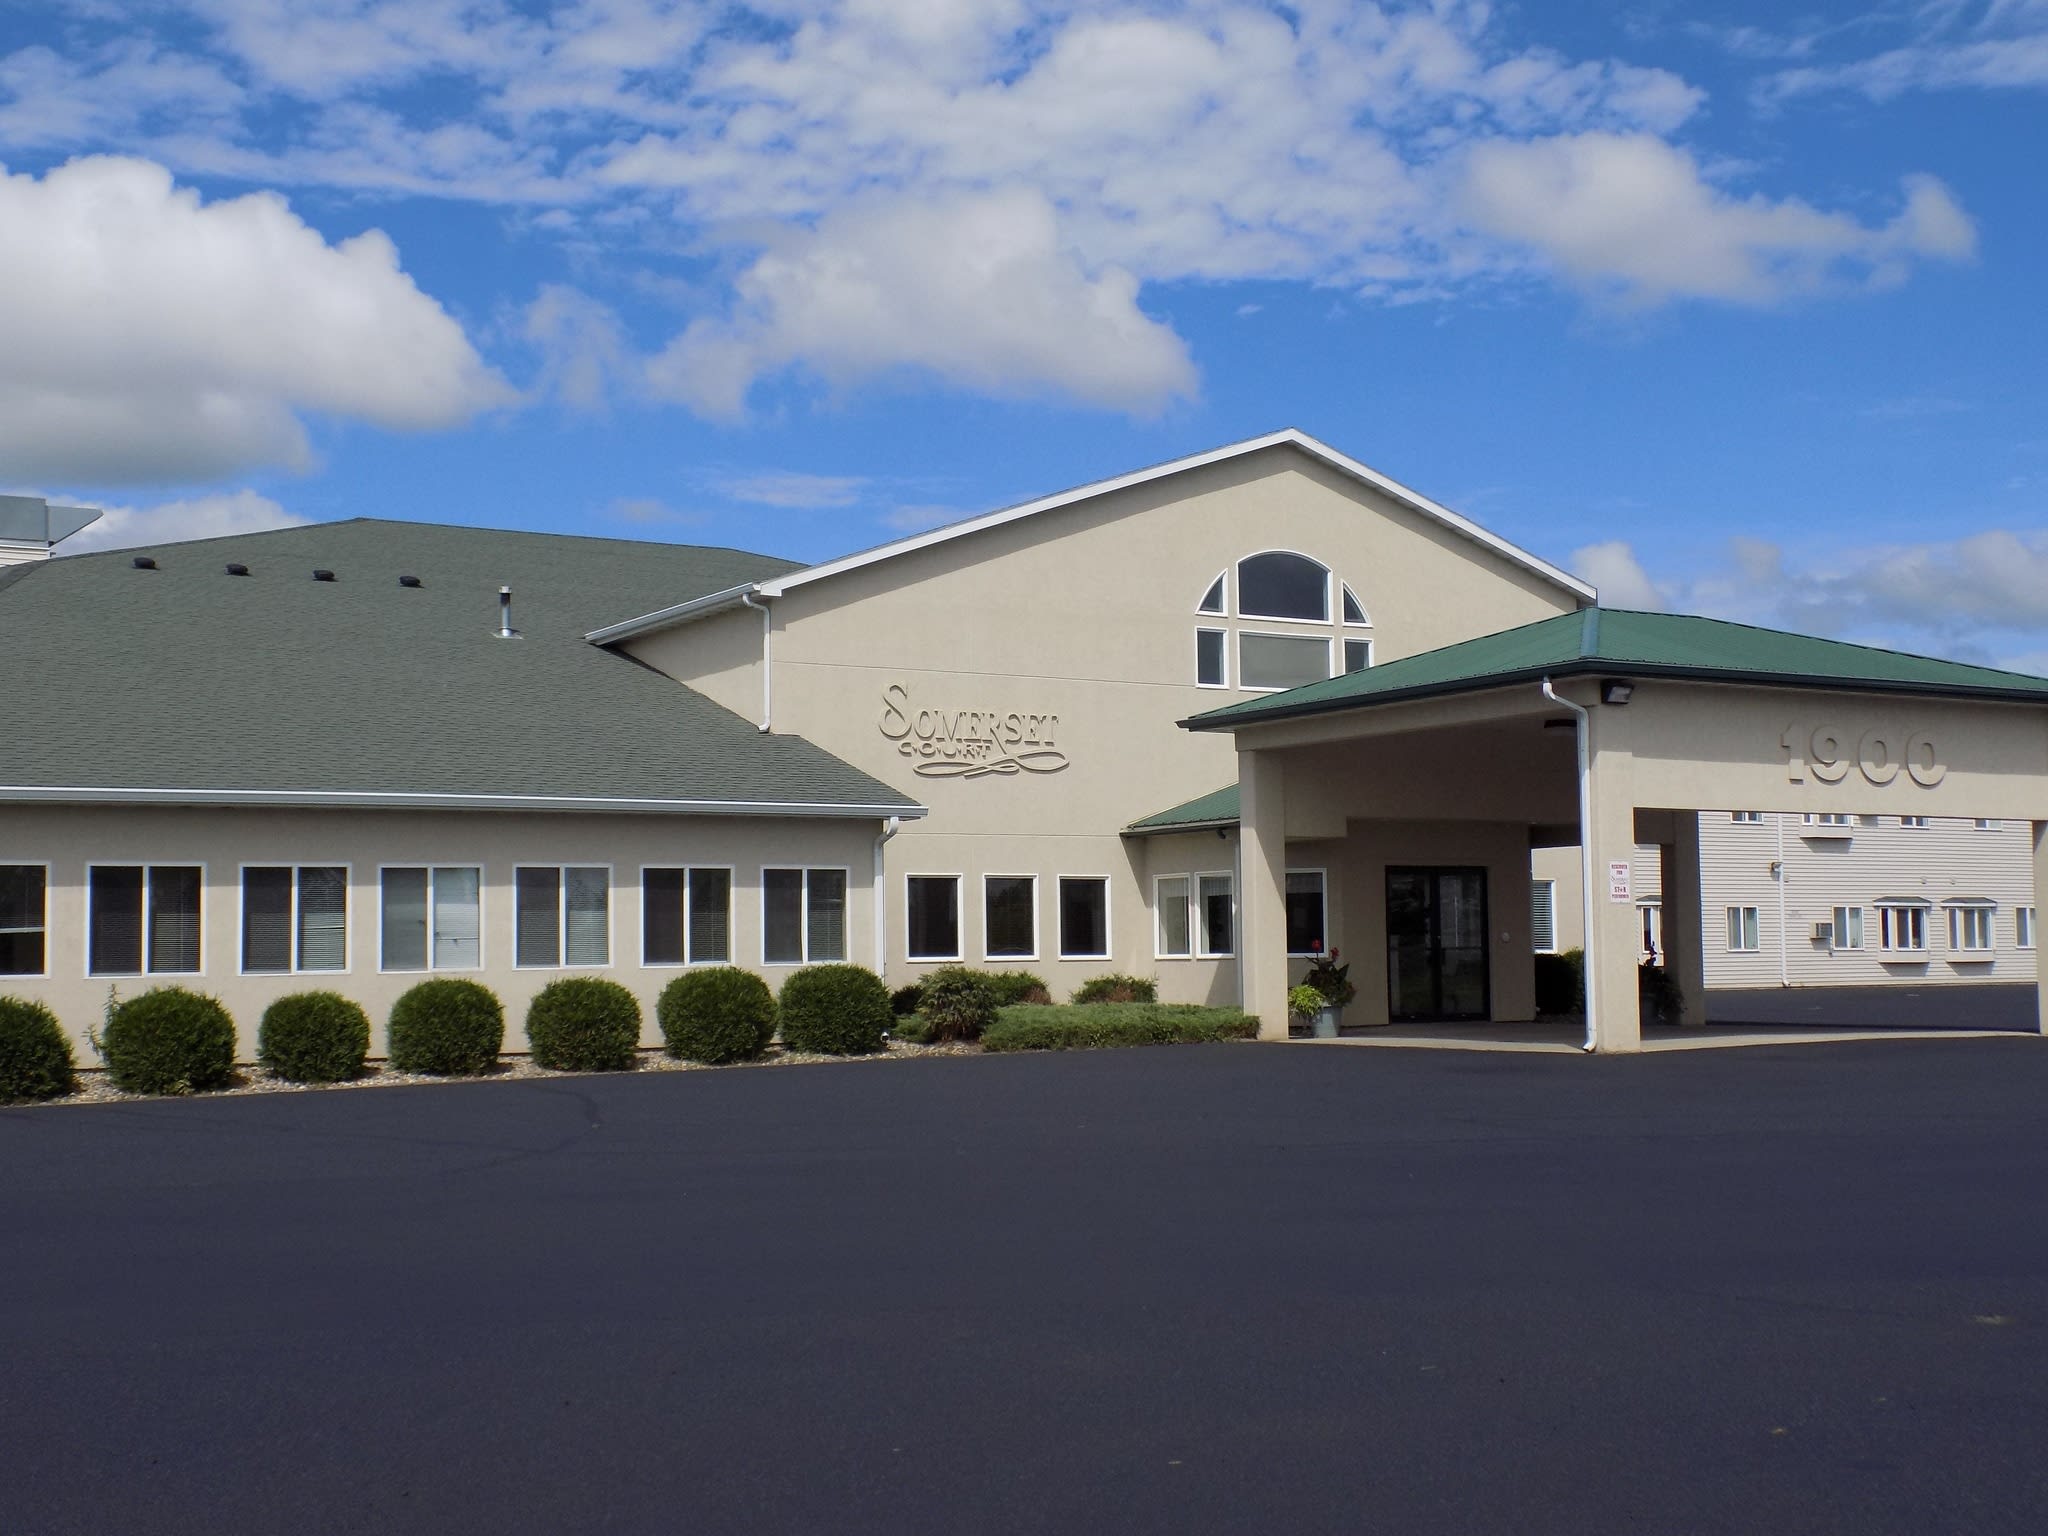
Somerset Court
1900 28th St SW, Minot, ND 58701 (3.1 mi from city center)Map of Assisted Living in Minot
Find the right senior living community by location- The View
- Minot Lodge Senior Living
- Elison of Minot
- Somerset Court
Senior Living Statistics for Minot, North Dakota
Average Senior Living Costs by Housing Type
The cost of senior housing in Minot varies depending on the type of accommodation and level of care. The following is the average monthly cost of senior housing based on data from 2023-2024.
| Housing Type | Average Monthly Cost |
|---|---|
| Assisted Living | $3,663 |
| Memory Care | $3,663 |
| Independent Living | $3,663 |
| Nursing Home: Private Room | $3,922 |
| Nursing Home: Semi-Private Room | $3,389 |
| Nursing Home: Studio | $4,588 |
| Nursing Home: One Bedroom | N/A |
| Nursing Home: Two Bedroom | N/A |
| Nursing Home: Detached Cottage | N/A |
Average Cost of Assisted Living in Minot
The following is the average monthly cost of assisted living in Minot based on 2024 data.
| City | Average Monthly Cost |
|---|---|
| Minot | $3,663 |
| Burlington | $3,663 |
| Voltaire | $3,324 |
Here is how the average cost of assisted living in Minot compares to North Dakota and the national average:
| Area | Average Monthly Cost |
|---|---|
| Minot | $3,663 |
| North Dakota | $3,842 |
| United States | $4,546 |
Senior Living Availability in Minot
Number of senior living facilities in:
Minot
Surrounding Area
North Dakota
Minot Senior Demographics
Based on information from 2023, here are some details around the population of Minot, such as age distribution for seniors, and racial diversity.
Population
Minot has a population of 48,038.- 52.2% Male
- 47.8% Female
Marital Status
- 47% Married
- 12.1% Divorced
- 36.3% Never Married
- 4.6% Widowed
Age
Seniors make up about 28.8% of the population.- 10.4% in their 50s
- 8.8% in their 60s
- 5.4% in their 70s
- 4.2% in their 80s
Diversity
- 82.2% White
- 4.5% Black
- 2.2% Asian
- 1.7% Native
- 0.1% Pacific
- 2% Identifying as Other
- 7.4% Mixed Race
- 7.4% Hispanic
Senior Living Ratings Methodology
Our experts spent over 50 hours researching the best communities in each city, focusing on these key factors.

Available Care
We value communities that offer more than standard living services, such as memory care and independent living. We think this is beneficial for older adults, as it allows a community to meet your changing needs over time.
Amenities
Amenities can help an assisted living community feel like a luxury resort or a home away from home. Our research focuses on communities that offer extra perks and benefits for seniors to enjoy.
Location
Location can be important. Since many seniors like to have certain comforts nearby, we look at communities close to parks, shopping areas, hospitals, museums, and other practical or entertaining points of interest.
Reviews
We read through dozens of reviews for every single contender and include a summary of our findings. In most cases, we see common themes regarding positive and negative feedback about each community. Just remember not to take individual reviews at face value.
Cost
Assisted living costs vary greatly based on the facility and level of care. We considered communities that are suitable for various budgets and offer solid value. All prices listed are from community websites.